
A Pilot Study Examining the Effects of Music Training on Attention in Children with Fetal Alcohol Spectrum Disorders (FASD)

 ,
,
Abstract
:1. Introduction
2. Materials and Methods
2.1. Participants
2.2. Cognitive Ability and Musical Aptitude
2.3. Music Training
2.4. Control Condition
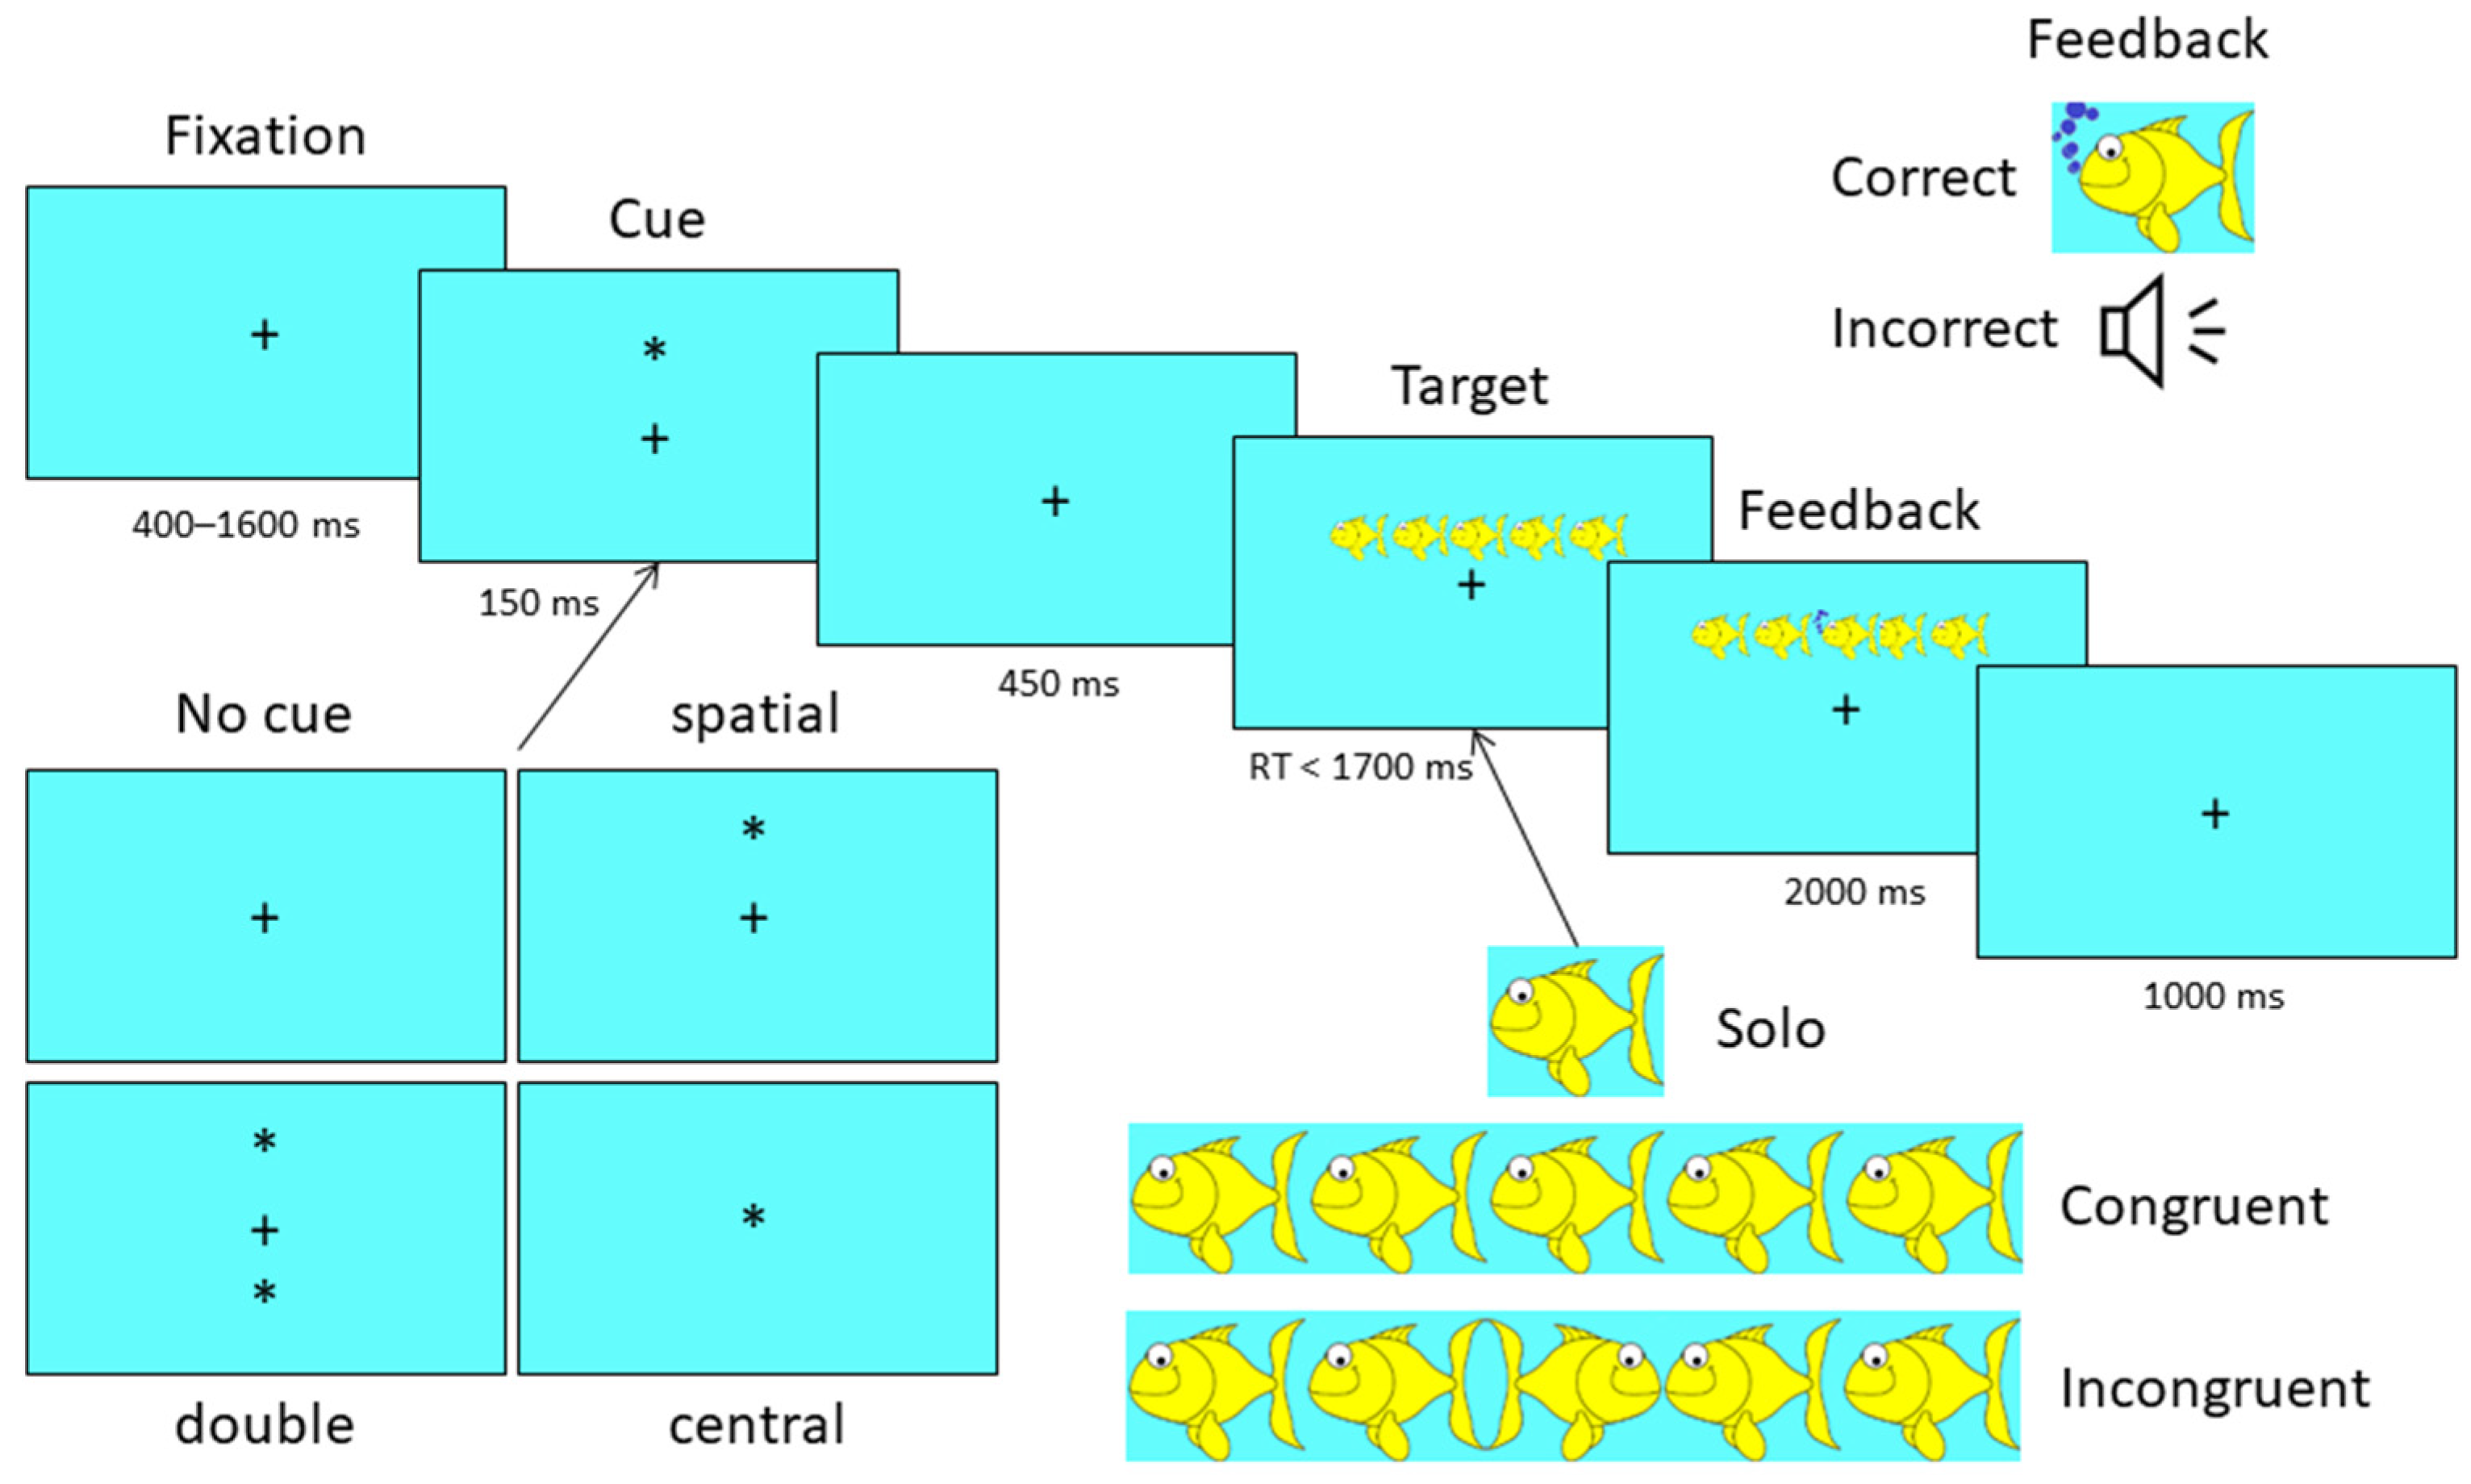
2.5. Attention Network Test (ANT)—Child Version
2.6. EEG
2.7. Statistical Analysis
3. Results
4. Discussion
5. Conclusions
Author Contributions
Funding
Institutional Review Board Statement
Informed Consent Statement
Data Availability Statement
Acknowledgments
Conflicts of Interest
References
- May, P.A.; Chambers, C.D.; Kalberg, W.O.; Zellner, J.; Feldman, H.; Buckley, D.; Kopald, D.; Hasken, J.M.; Xu, R.; Honerkamp-Smith, G.; et al. Prevalence of Fetal Alcohol Spectrum Disorders in 4 US Communities. JAMA 2018, 319, 474–482. [Google Scholar] [CrossRef] [PubMed]
- Kodituwakku, P.; Segall, J.M.; Beatty, G.K. Cognitive and behavioral effects of prenatal alcohol exposure. Future Neurol. 2011, 6, 237–259. [Google Scholar] [CrossRef]
- Stephen, J.; Kodituwakku, P.; Kodituwakku, E.L.; Romero, L.; Peters, A.M.; Sharadamma, N.M.; Caprihan, A.; Coffman, B.A. Delays in auditory processing identified in preschool children with FASD. Alcohol. Clin. Exp. Res. 2012, 36, 1720–1727. [Google Scholar] [CrossRef] [PubMed] [Green Version]
- Mattson, S.N.; Crocker, N.; Nguyen, T.T. Fetal alcohol spectrum disorders: Neuropsychological and behavioral features. Neuropsychol. Rev. 2011, 21, 81–101. [Google Scholar] [CrossRef] [PubMed] [Green Version]
- Burden, M.J.; Jacobson, S.W.; Sokol, R.J.; Jacobson, J.L. Effects of prenatal alcohol exposure on attention and working memory at 7.5 years of age. Alcohol. Clin. Exp. Res. 2005, 29, 443–452. [Google Scholar] [CrossRef] [PubMed]
- Hemington, K.S.; Reynolds, J.N. Electroencephalographic correlates of working memory deficits in children with Fetal Alcohol Spectrum Disorder using a single-electrode pair recording device. Clin. Neurophysiol. 2014, 125, 2364–2371. [Google Scholar] [CrossRef]
- Inkelis, S.M.; Moore, E.M.; Bischoff-Grethe, A.; Riley, E.P. Neurodevelopment in adolescents and adults with fetal alcohol spectrum disorders (FASD): A magnetic resonance region of interest analysis. Brain Res. 2020, 1732, 146654. [Google Scholar] [CrossRef] [PubMed]
- Bolanos, A.D.; Coffman, B.A.; Candelaria-Cook, F.T.; Kodituwakku, P.; Stephen, J.M. Altered Neural Oscillations during Multisensory Integration in Adolescents with Fetal Alcohol Spectrum Disorder. Alcohol. Clin. Exp. Res. 2017, 41, 2173–2184. [Google Scholar] [CrossRef]
- Stephen, J.M.; Coffman, B.A.; Stone, D.B.; Kodituwakku, P. Differences in MEG gamma oscillatory power during performance of a prosaccade task in adolescents with FASD. Front. Hum. Neurosci. 2013, 7, 900. [Google Scholar] [CrossRef] [Green Version]
- Coffman, B.A.; Kodituwakku, P.; Kodituwakku, E.L.; Romero, L.; Sharadamma, N.M.; Stone, D.; Stephen, J.M. Primary visual response (M100) delays in adolescents with FASD as measured with MEG. Hum. Brain Mapp. 2013, 34, 2852–2862. [Google Scholar] [CrossRef] [PubMed] [Green Version]
- Rema, V.; Ebner, F.F. Effect of enriched environment rearing on impairments in cortical excitability and plasticity after prenatal alcohol exposure. J. Neurosci. 1999, 19, 10993–11006. [Google Scholar] [CrossRef] [PubMed] [Green Version]
- Kajimoto, K.; Valenzuela, C.F.; Allan, A.M.; Ge, S.; Gu, Y.; Cunningham, L.A. Prenatal alcohol exposure alters synaptic activity of adult hippocampal dentate granule cells under conditions of enriched environment. Hippocampus 2016, 26, 1078–1087. [Google Scholar] [CrossRef] [PubMed] [Green Version]
- Hudziak, J.J.; Albaugh, M.D.; Ducharme, S.; Karama, S.; Spottswood, M.; Crehan, E.; Evans, A.C.; Botteron, K.N. Cortical thickness maturation and duration of music training: Health-promoting activities shape brain development. J. Am. Acad. Child Adolesc. Psychiatry 2014, 53, 1153–1161.e2. [Google Scholar] [CrossRef] [PubMed] [Green Version]
- Pantev, C.; Paraskevopoulos, E.; Kuchenbuch, A.; Lu, Y.; Herholz, S.C. Musical expertise is related to neuroplastic changes of multisensory nature within the auditory cortex. Eur. J. Neurosci. 2015, 41, 709–717. [Google Scholar] [CrossRef] [PubMed]
- Paraskevopoulos, E.; Kuchenbuch, A.; Herholz, S.C.; Foroglou, N.; Bamidis, P.; Pantev, C. Tones and numbers: A combined EEG-MEG study on the effects of musical expertise in magnitude comparisons of audiovisual stimuli. Hum. Brain Mapp. 2014, 35, 5389–5400. [Google Scholar] [CrossRef] [PubMed]
- Schlaug, G.; Norton, A.; Overy, K.; Winner, E. Effects of music training on the child’s brain and cognitive development. Ann. N. Y. Acad. Sci. 2005, 1060, 219–230. [Google Scholar] [CrossRef] [Green Version]
- Kraus, N.; Hornickel, J.; Strait, D.L.; Slater, J.; Thompson, E. Engagement in community music classes sparks neuroplasticity and language development in children from disadvantaged backgrounds. Front. Psychol. 2014, 5, 1403. [Google Scholar] [CrossRef] [PubMed] [Green Version]
- Janus, M.; Lee, Y.; Moreno, S.; Bialystok, E. Effects of short-term music and second-language training on executive control. J. Exp. Child Psychol. 2016, 144, 84–97. [Google Scholar] [CrossRef] [PubMed] [Green Version]
- Dewi, E.K.; Rusmawati, D.; Ratnaningsih, I.Z. The Effect of Music and Motoric Movement Intervention to Increase Attention among Elementary School Studentsin Semarang Central Java. Procedia Environ. Sci. 2015, 23, 179–185. [Google Scholar] [CrossRef] [Green Version]
- Rabeyron, T.; Robledo Del Canto, J.P.; Carasco, E.; Bisson, V.; Bodeau, N.; Vrait, F.X.; Berna, F.; Bonnot, O. A randomized controlled trial of 25 sessions comparing music therapy and music listening for children with autism spectrum disorder. Psychiatry Res. 2020, 293, 113377. [Google Scholar] [CrossRef]
- Belski, N.; Abdul-Rahman, Z.; Youn, E.; Balasundaram, V.; Diep, D. Review: The effectiveness of musical therapy in improving depression and anxiety symptoms among children and adolescents—A systematic review. Child Adolesc. Ment. Health 2021. [Google Scholar] [CrossRef]
- Begel, V.; Bachrach, A.; Dalla Bella, S.; Laroche, J.; Clement, S.; Riquet, A.; Dellacherie, D. Dance Improves Motor, Cognitive, and Social Skills in Children with Developmental Cerebellar Anomalies. Cerebellum 2022, 21, 264–279. [Google Scholar] [CrossRef]
- Guo, X.; Yamashita, M.; Suzuki, M.; Ohsawa, C.; Asano, K.; Abe, N.; Soshi, T.; Sekiyama, K. Musical instrument training program improves verbal memory and neural efficiency in novice older adults. Hum. Brain Mapp. 2021, 42, 1359–1375. [Google Scholar] [CrossRef] [PubMed]
- James, C.E.; Zuber, S.; Dupuis-Lozeron, E.; Abdili, L.; Gervaise, D.; Kliegel, M. Formal String Instrument Training in a Class Setting Enhances Cognitive and Sensorimotor Development of Primary School Children. Front. Neurosci. 2020, 14, 567. [Google Scholar] [CrossRef] [PubMed]
- Barrett, K.C.; Ashley, R.; Strait, D.L.; Kraus, N. Art and science: How musical training shapes the brain. Front. Psychol. 2013, 4, 713. [Google Scholar] [CrossRef] [Green Version]
- Elbert, T.; Pantev, C.; Wienbruch, C.; Rockstroh, B.; Taub, E. Increased cortical representation of the fingers of the left hand in string players. Science 1995, 270, 305–307. [Google Scholar] [CrossRef] [Green Version]
- Worschech, F.; Altenmuller, E.; Junemann, K.; Sinke, C.; Kruger, T.H.C.; Scholz, D.S.; Muller, C.A.H.; Kliegel, M.; James, C.E.; Marie, D. Evidence of cortical thickness increases in bilateral auditory brain structures following piano learning in older adults. Ann. N. Y. Acad. Sci. 2022, 1513, 21–30. [Google Scholar] [CrossRef]
- Habibi, A.; Ilari, B.; Heine, K.; Damasio, H. Changes in auditory cortical thickness following music training in children: Converging longitudinal and cross-sectional results. Brain Struct. Funct. 2020, 225, 2463–2474. [Google Scholar] [CrossRef] [PubMed]
- Petersen, S.E.; Posner, M.I. The attention system of the human brain: 20 years after. Annu. Rev. Neurosci. 2012, 35, 73–89. [Google Scholar] [CrossRef] [Green Version]
- Posner, M.I. Imaging attention networks. Neuroimage 2012, 61, 450–456. [Google Scholar] [CrossRef] [Green Version]
- Stevens, C.; Bavelier, D. The role of selective attention on academic foundations: A cognitive neuroscience perspective. Dev. Cogn. Neurosci. 2012, 2, S30–S48. [Google Scholar] [CrossRef]
- Rueda, M.R.; Fan, J.; McCandliss, B.D.; Halparin, J.D.; Gruber, D.B.; Lercari, L.P.; Posner, M.I. Development of attentional networks in childhood. Neuropsychologia 2004, 42, 1029–1040. [Google Scholar] [CrossRef] [PubMed]
- Rueda, M.R.; Rothbart, M.K.; McCandliss, B.D.; Saccomanno, L.; Posner, M.I. Training, maturation, and genetic influences on the development of executive attention. Proc. Natl. Acad. Sci. USA 2005, 102, 14931–14936. [Google Scholar] [CrossRef] [Green Version]
- Overbye, K.; Walhovd, K.B.; Fjell, A.M.; Tamnes, C.K.; Huster, R.J. Electrophysiological and behavioral indices of cognitive conflict processing across adolescence. Dev. Cogn. Neurosci. 2021, 48, 100929. [Google Scholar] [CrossRef] [PubMed]
- Cavanagh, J.F.; Frank, M.J. Frontal theta as a mechanism for cognitive control. Trends Cogn. Sci. 2014, 18, 414–421. [Google Scholar] [CrossRef] [Green Version]
- Xue, S.W.; Tang, Y.Y.; Tang, R.; Posner, M.I. Short-term meditation induces changes in brain resting EEG theta networks. Brain Cogn. 2014, 87, 1–6. [Google Scholar] [CrossRef] [PubMed]
- McDermott, J.M.; Perez-Edgar, K.; Fox, N.A. Variations of the flanker paradigm: Assessing selective attention in young children. Behav. Res. Methods 2007, 39, 62–70. [Google Scholar] [CrossRef] [PubMed] [Green Version]
- Nakano, H. EEG Measurement as a Tool for Rehabilitation Assessment and Treatment. In Electroencephalography—From Basic Research to Clinical Applications; Nakano, H., Ed.; IntechOpen: London, UK, 2021. [Google Scholar]
- Lin, M.H.; Davies, P.L.; Stephens, J.; Gavin, W.J. Test-Retest Reliability of Electroencephalographic Measures of Performance Monitoring in Children and Adults. Dev. Neuropsychol. 2020, 45, 341–366. [Google Scholar] [CrossRef]
- Hoyme, H.E.; May, P.A.; Kalberg, W.O.; Kodituwakku, P.; Gossage, J.P.; Trujillo, P.M.; Buckley, D.G.; Miller, J.H.; Aragon, A.S.; Khaole, N.; et al. A practical clinical approach to diagnosis of fetal alcohol spectrum disorders: Clarification of the 1996 institute of medicine criteria. Pediatrics 2005, 115, 39–47. [Google Scholar] [CrossRef] [Green Version]
- Kaufman, A.S.; Kaufman, N.L. Kaufman Brief Intelligence Test (KBIT-2), 2nd ed.; Pearson: New York, NY, USA, 2002. [Google Scholar]
- Gordon, E.E. Primary Measures of Music Audiation; GIA Publications, Inc.: Chicago, IL, USA, 1979. [Google Scholar]
- Fan, J.; McCandliss, B.D.; Sommer, T.; Raz, A.; Posner, M.I. Testing the efficiency and independence of attentional networks. J. Cogn. Neurosci. 2002, 14, 340–347. [Google Scholar] [CrossRef]
- Delorme, A.; Makeig, S. EEGLAB: An open source toolbox for analysis of single-trial EEG dynamics including independent component analysis. J. Neurosci. Methods 2004, 134, 9–21. [Google Scholar] [CrossRef] [PubMed] [Green Version]
- Monastra, V.J.; Lubar, J.F.; Linden, M.; VanDeusen, P.; Green, G.; Wing, W.; Phillips, A.; Fenger, T.N. Assessing attention deficit hyperactivity disorder via quantitative electroencephalography: An initial validation study. Neuropsychology 1999, 13, 424–433. [Google Scholar] [CrossRef] [PubMed]
- Barbaroux, M.; Dittinger, E.; Besson, M. Music training with Demos program positively influences cognitive functions in children from low socio-economic backgrounds. PLoS ONE 2019, 14, e0216874. [Google Scholar] [CrossRef] [PubMed]
- Cheung, M.C.; Chan, A.S.; Liu, Y.; Law, D.; Wong, C.W. Music training is associated with cortical synchronization reflected in EEG coherence during verbal memory encoding. PLoS ONE 2017, 12, e0174906. [Google Scholar] [CrossRef] [Green Version]
- Moreno, S.; Farzan, F. Music training and inhibitory control: A multidimensional model. Ann. N. Y. Acad. Sci. 2015, 1337, 147–152. [Google Scholar] [CrossRef] [PubMed]
- Habibi, A.; Damasio, A.; Ilari, B.; Elliott Sachs, M.; Damasio, H. Music training and child development: A review of recent findings from a longitudinal study. Ann. N. Y. Acad. Sci. 2018, 1423, 73–81. [Google Scholar] [CrossRef] [PubMed]
- Marquez-Garcia, A.V.; Magnuson, J.; Morris, J.; Iarocci, G.; Doesburg, S.; Moreno, S. Music Therapy in Autism Spectrum Disorder: A Systematic Review. Rev. J. Autism Dev. Dis. 2022, 9, 91–107. [Google Scholar] [CrossRef]
- Moreno-Morales, C.; Calero, R.; Moreno-Morales, P.; Pintado, C. Music Therapy in the Treatment of Dementia: A Systematic Review and Meta-Analysis. Front. Med. 2020, 7, 160. [Google Scholar] [CrossRef]
- Fan, J.; Wu, Y.; Fossella, J.A.; Posner, M.I. Assessing the heritability of attentional networks. BMC Neurosci. 2001, 2, 14. [Google Scholar] [CrossRef] [PubMed]
- Posner, M.I.; Rothbart, M.K.; Ghassemzadeh, H. Restoring Attention Networks. Yale J. Biol. Med. 2019, 92, 139–143. [Google Scholar]
- Sala, G.; Gobet, F. Cognitive and academic benefits of music training with children: A multilevel meta-analysis. Mem. Cogn. 2020, 48, 1429–1441. [Google Scholar] [CrossRef] [PubMed]
- Hille, A.; Schupp, J. How learning a musical instrument affects the development of skills. Econ. Educ. Rev. 2015, 44, 56–82. [Google Scholar] [CrossRef] [Green Version]
- Rowland, A.S.; Skipper, B.J.; Rabiner, D.L.; Qeadan, F.; Campbell, R.A.; Naftel, A.J.; Umbach, D.M. Attention-Deficit/Hyperactivity Disorder (ADHD): Interaction between socioeconomic status and parental history of ADHD determines prevalence. J. Child Psychol. Psychiatry 2018, 59, 213–222. [Google Scholar] [CrossRef] [PubMed]
- Lund, J.I.; Toombs, E.; Radford, A.; Boles, K.; Mushquash, C. Adverse Childhood Experiences and Executive Function Difficulties in Children: A Systematic Review. Child Abus. Negl. 2020, 106, 104485. [Google Scholar] [CrossRef]
- Doney, R.; Lucas, B.R.; Jones, T.; Howat, P.; Sauer, K.; Elliott, E.J. Fine motor skills in children with prenatal alcohol exposure or fetal alcohol spectrum disorder. J. Dev. Behav. Pediatr. 2014, 35, 598–609. [Google Scholar] [CrossRef] [PubMed] [Green Version]


| Music Training (N = 9) | Control (N = 8) | p-Value | |
|---|---|---|---|
| Age (mean, SD) | 7.67 (1.80) | 8.00 (1.87) | 0.72 |
| Sex (Male/Female) | 6/3 | 5/3 | 0.85 |
| Diagnosis (FAS/pFAS/ARND) | 5/0/4 | 0/2/6 | 0.20 |
| KBIT Verbal (mean, SD) | 88.44 (17.17) | 85.00 (11.13) | 0.64 |
| KBIT Nonverbal (mean, SD) | 92.33 (12.09) | 95.40 (8.44) | 0.56 |
| KBIT Composite (mean, SD) | 88.89 (14.65) | 88.00 (9.89) | 0.89 |
| Tonal (mean, SD) | 29.11 (4.70) | 32.80 (1.92) | 0.056 |
| Rhythm (mean, SD) | 28.55 (4.39) | 28.80 (2.77) | 0.89 |
| ANT Hits RT Pre (ms; mean, SEM) | 1029 (53.1) | 1000 (60.3) | 0.31 |
| ANT Hits RT Post (ms; mean, SEM) | 898 (52.6) | 1017 (59.7) | 0.0006 |
| ANT #epochs Session1-Congruent | 35.3 (2.1) | 34.7 (3.3) | 0.71 |
| ANT #epochs Session2-Congruent | 33.1 (3.2) | 31.4 (3.5) | 0.36 |
| Condition | MT-Pre | MT-Post | Control-Pre | Control-Post |
|---|---|---|---|---|
| Alterting RT | 58 (101) | 110 (75) | 15 (53) | 87 (132) |
| Orienting RT | 45 (73) | 77 (74) | 51 (86) | 62 (100) |
| Conflict RT | 139 (99) | 146 (76) | 199 (112) | 116 (91) |
| Condition | MT-Pre | MT-Post | Control-Pre | Control-Post |
|---|---|---|---|---|
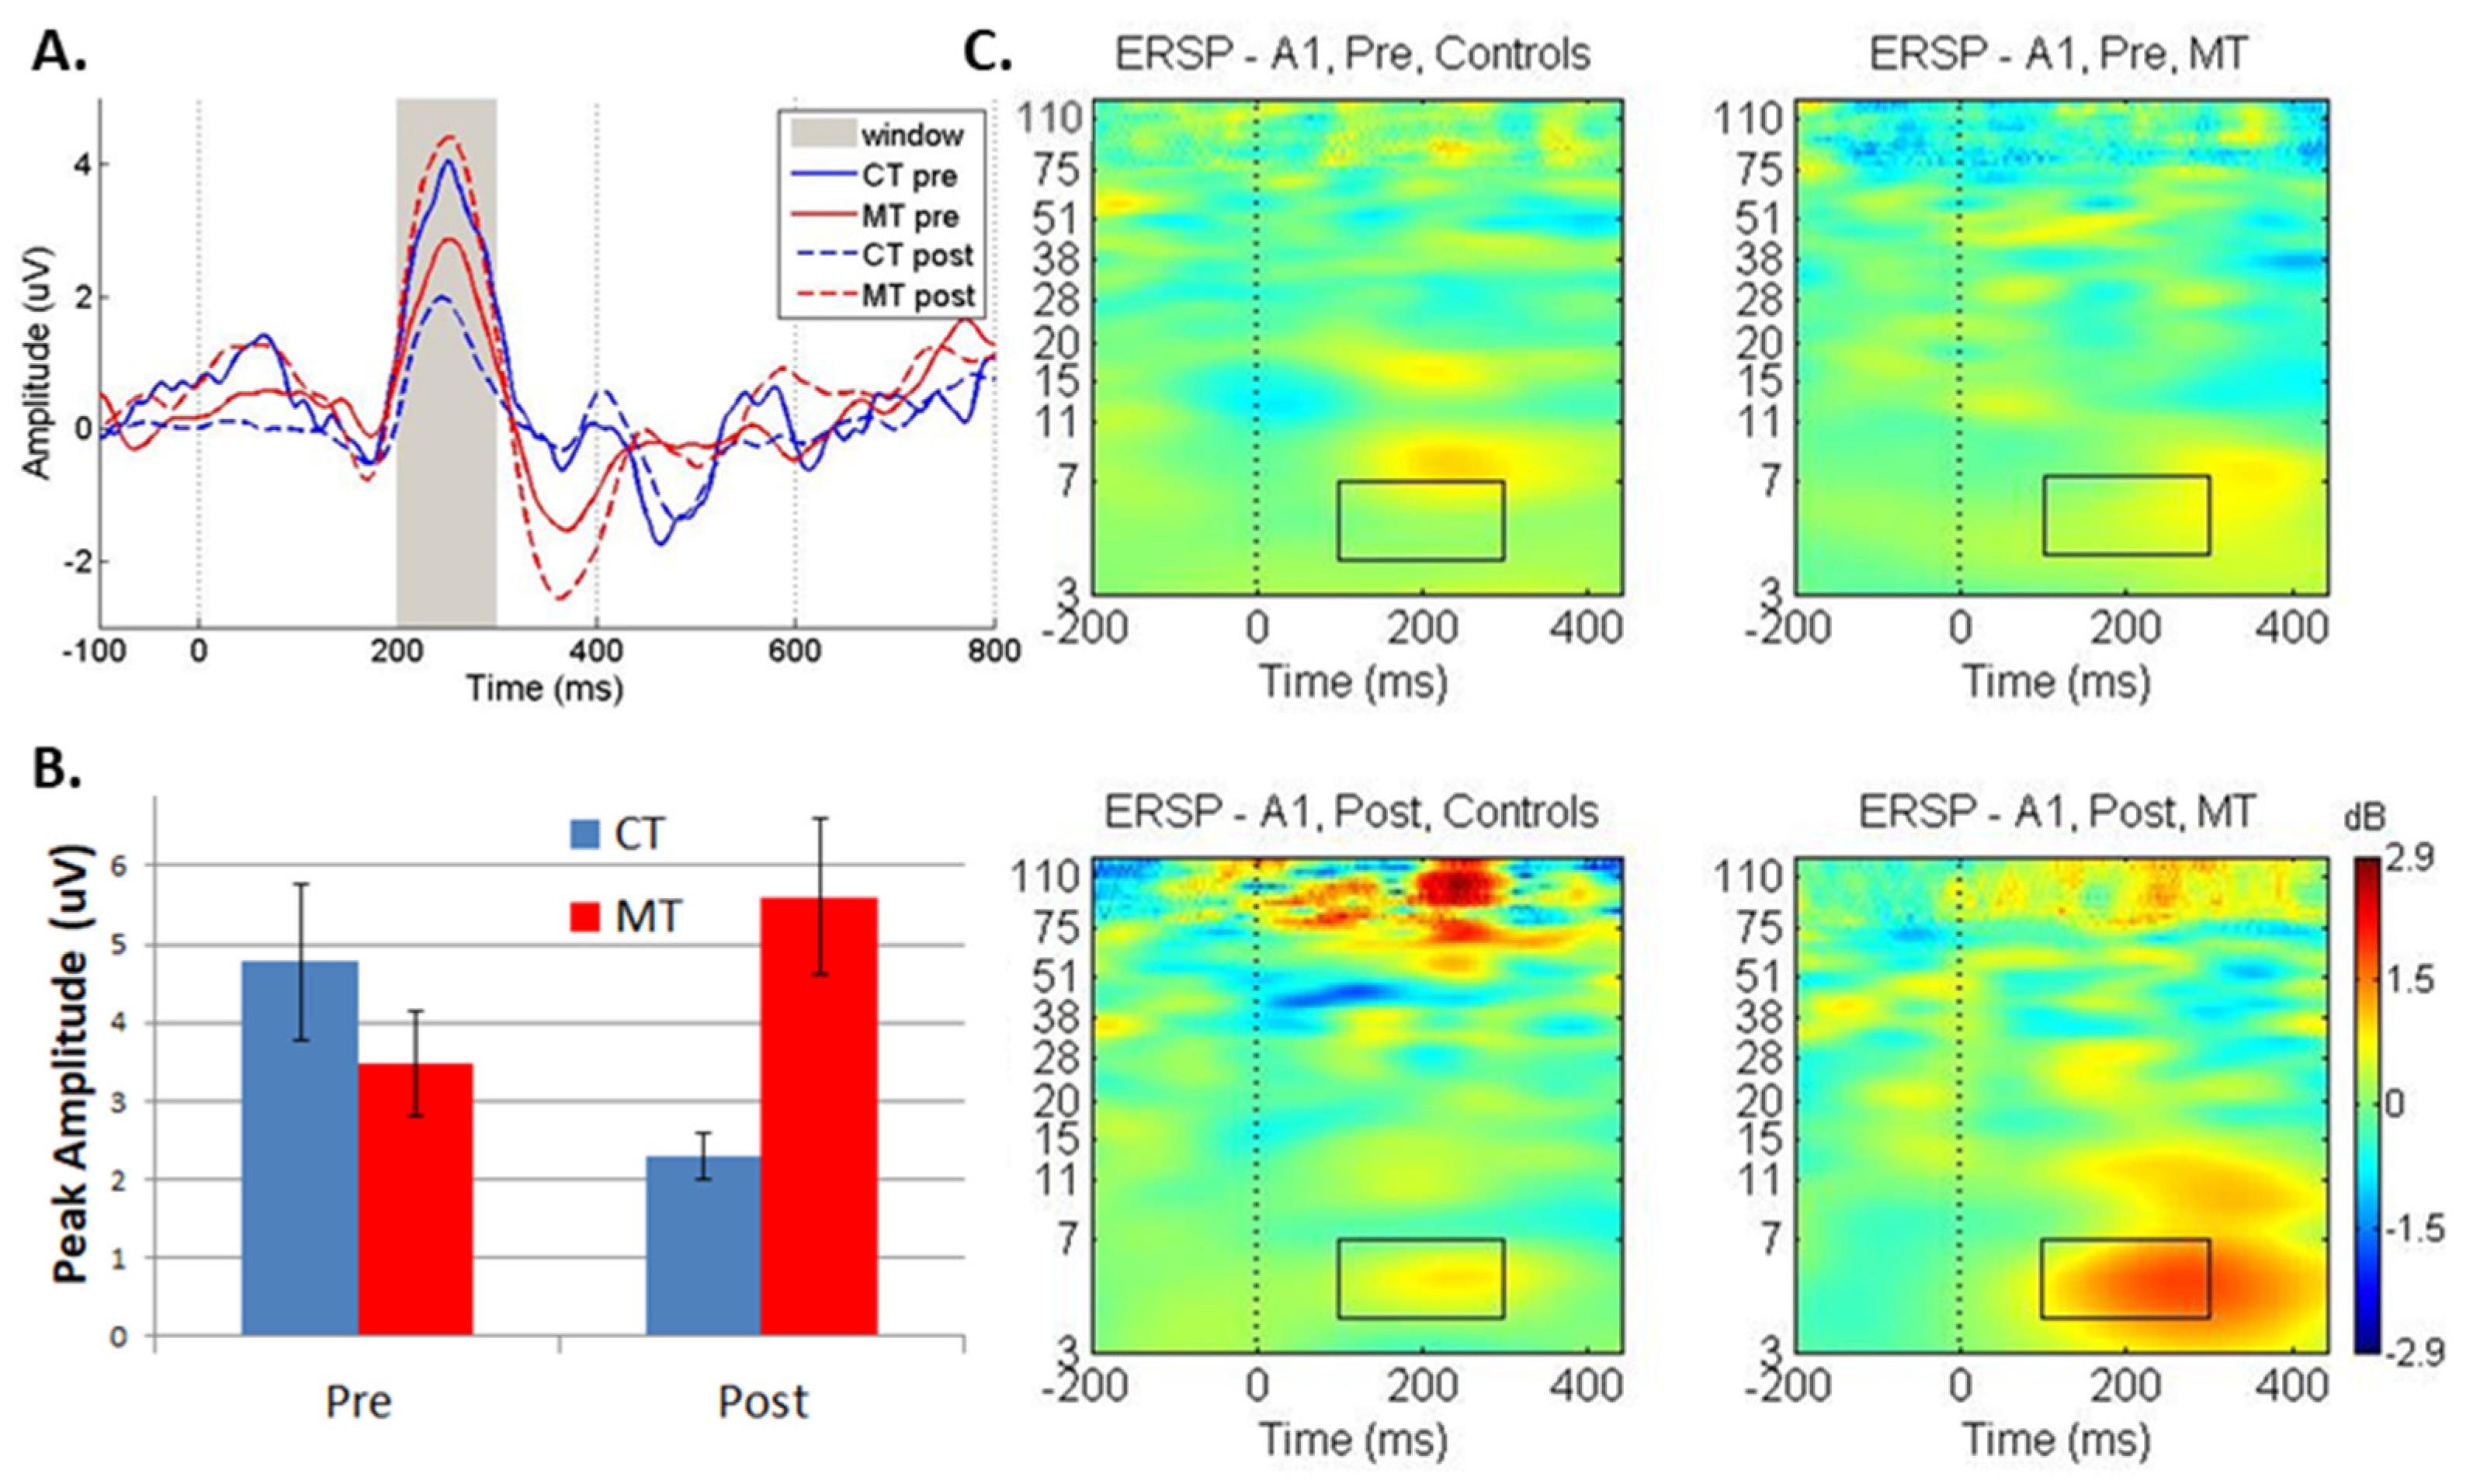
| Amplitude (μV) | ||||
| Solo | 3.37 (1.97) | 5.21 (2.74) | 4.13 (1.77) | 1.71 (1.10) |
| Congruent | 3.48 (1.76) | 5.60 (2.66) | 4.78 (2.66) | 2.30 (0.78) |
| Incongruent | 3.88 (2.10) | 5.75 (3.72) | 4.12 (2.25) | 2.77 (1.63) |
| Latency (ms) | ||||
| Solo | 244 (27) | 261 (29) | 252 (24) | 238 (18) |
| Congruent | 243 (23) | 232 (25) | 241 (29) | 251 (23) |
| Incongruent | 240 (21) | 242 (23) | 237 (19) | 239 (11) |
| Condition | Solo | Congruent | Incongruent | |||
|---|---|---|---|---|---|---|
| Amplitude | F-statistic | p-value | F-statistic | p-value | F-statistic | p-value |
| Pre-Post | 0.15 | 0.71 | 0.08 | 0.78 | 0.08 | 0.77 |
| Group | 3.33 | 0.093 | 1.17 | 0.3 | 1.68 | 0.22 |
| Pre-Post × Group | 8.11 | 0.015 * | 12.6 | 0.004 * | 3.49 | 0.086 |
| Latency | ||||||
| Pre-Post | 0.06 | 0.81 | 0.004 | 0.952 | 0.16 | 0.70 |
| Group | 0.39 | 0.54 | 0.61 | 0.45 | 0.11 | 0.75 |
| Pre-Post × Group | 8.21 | 0.014 * | 1.35 | 0.267 | 0.01 | 0.92 |
Publisher’s Note: MDPI stays neutral with regard to jurisdictional claims in published maps and institutional affiliations. |
© 2022 by the authors. Licensee MDPI, Basel, Switzerland. This article is an open access article distributed under the terms and conditions of the Creative Commons Attribution (CC BY) license (https://creativecommons.org/licenses/by/4.0/).
Share and Cite
Gleichmann, D.C.; Pinner, J.F.L.; Garcia, C.; Hakeem, J.H.; Kodituwakku, P.; Stephen, J.M. A Pilot Study Examining the Effects of Music Training on Attention in Children with Fetal Alcohol Spectrum Disorders (FASD). Sensors 2022, 22, 5642. https://doi.org/10.3390/s22155642
Gleichmann DC, Pinner JFL, Garcia C, Hakeem JH, Kodituwakku P, Stephen JM. A Pilot Study Examining the Effects of Music Training on Attention in Children with Fetal Alcohol Spectrum Disorders (FASD). Sensors. 2022; 22(15):5642. https://doi.org/10.3390/s22155642
Chicago/Turabian StyleGleichmann, Dathan C., John F. L. Pinner, Christopher Garcia, Jaynie H. Hakeem, Piyadasa Kodituwakku, and Julia M. Stephen. 2022. "A Pilot Study Examining the Effects of Music Training on Attention in Children with Fetal Alcohol Spectrum Disorders (FASD)" Sensors 22, no. 15: 5642. https://doi.org/10.3390/s22155642