
Aging-Related Behavioral, Adiposity, and Glucose Impairments and Their Association following Prenatal Alcohol Exposure in the C57BL/6J Mouse

 and
and 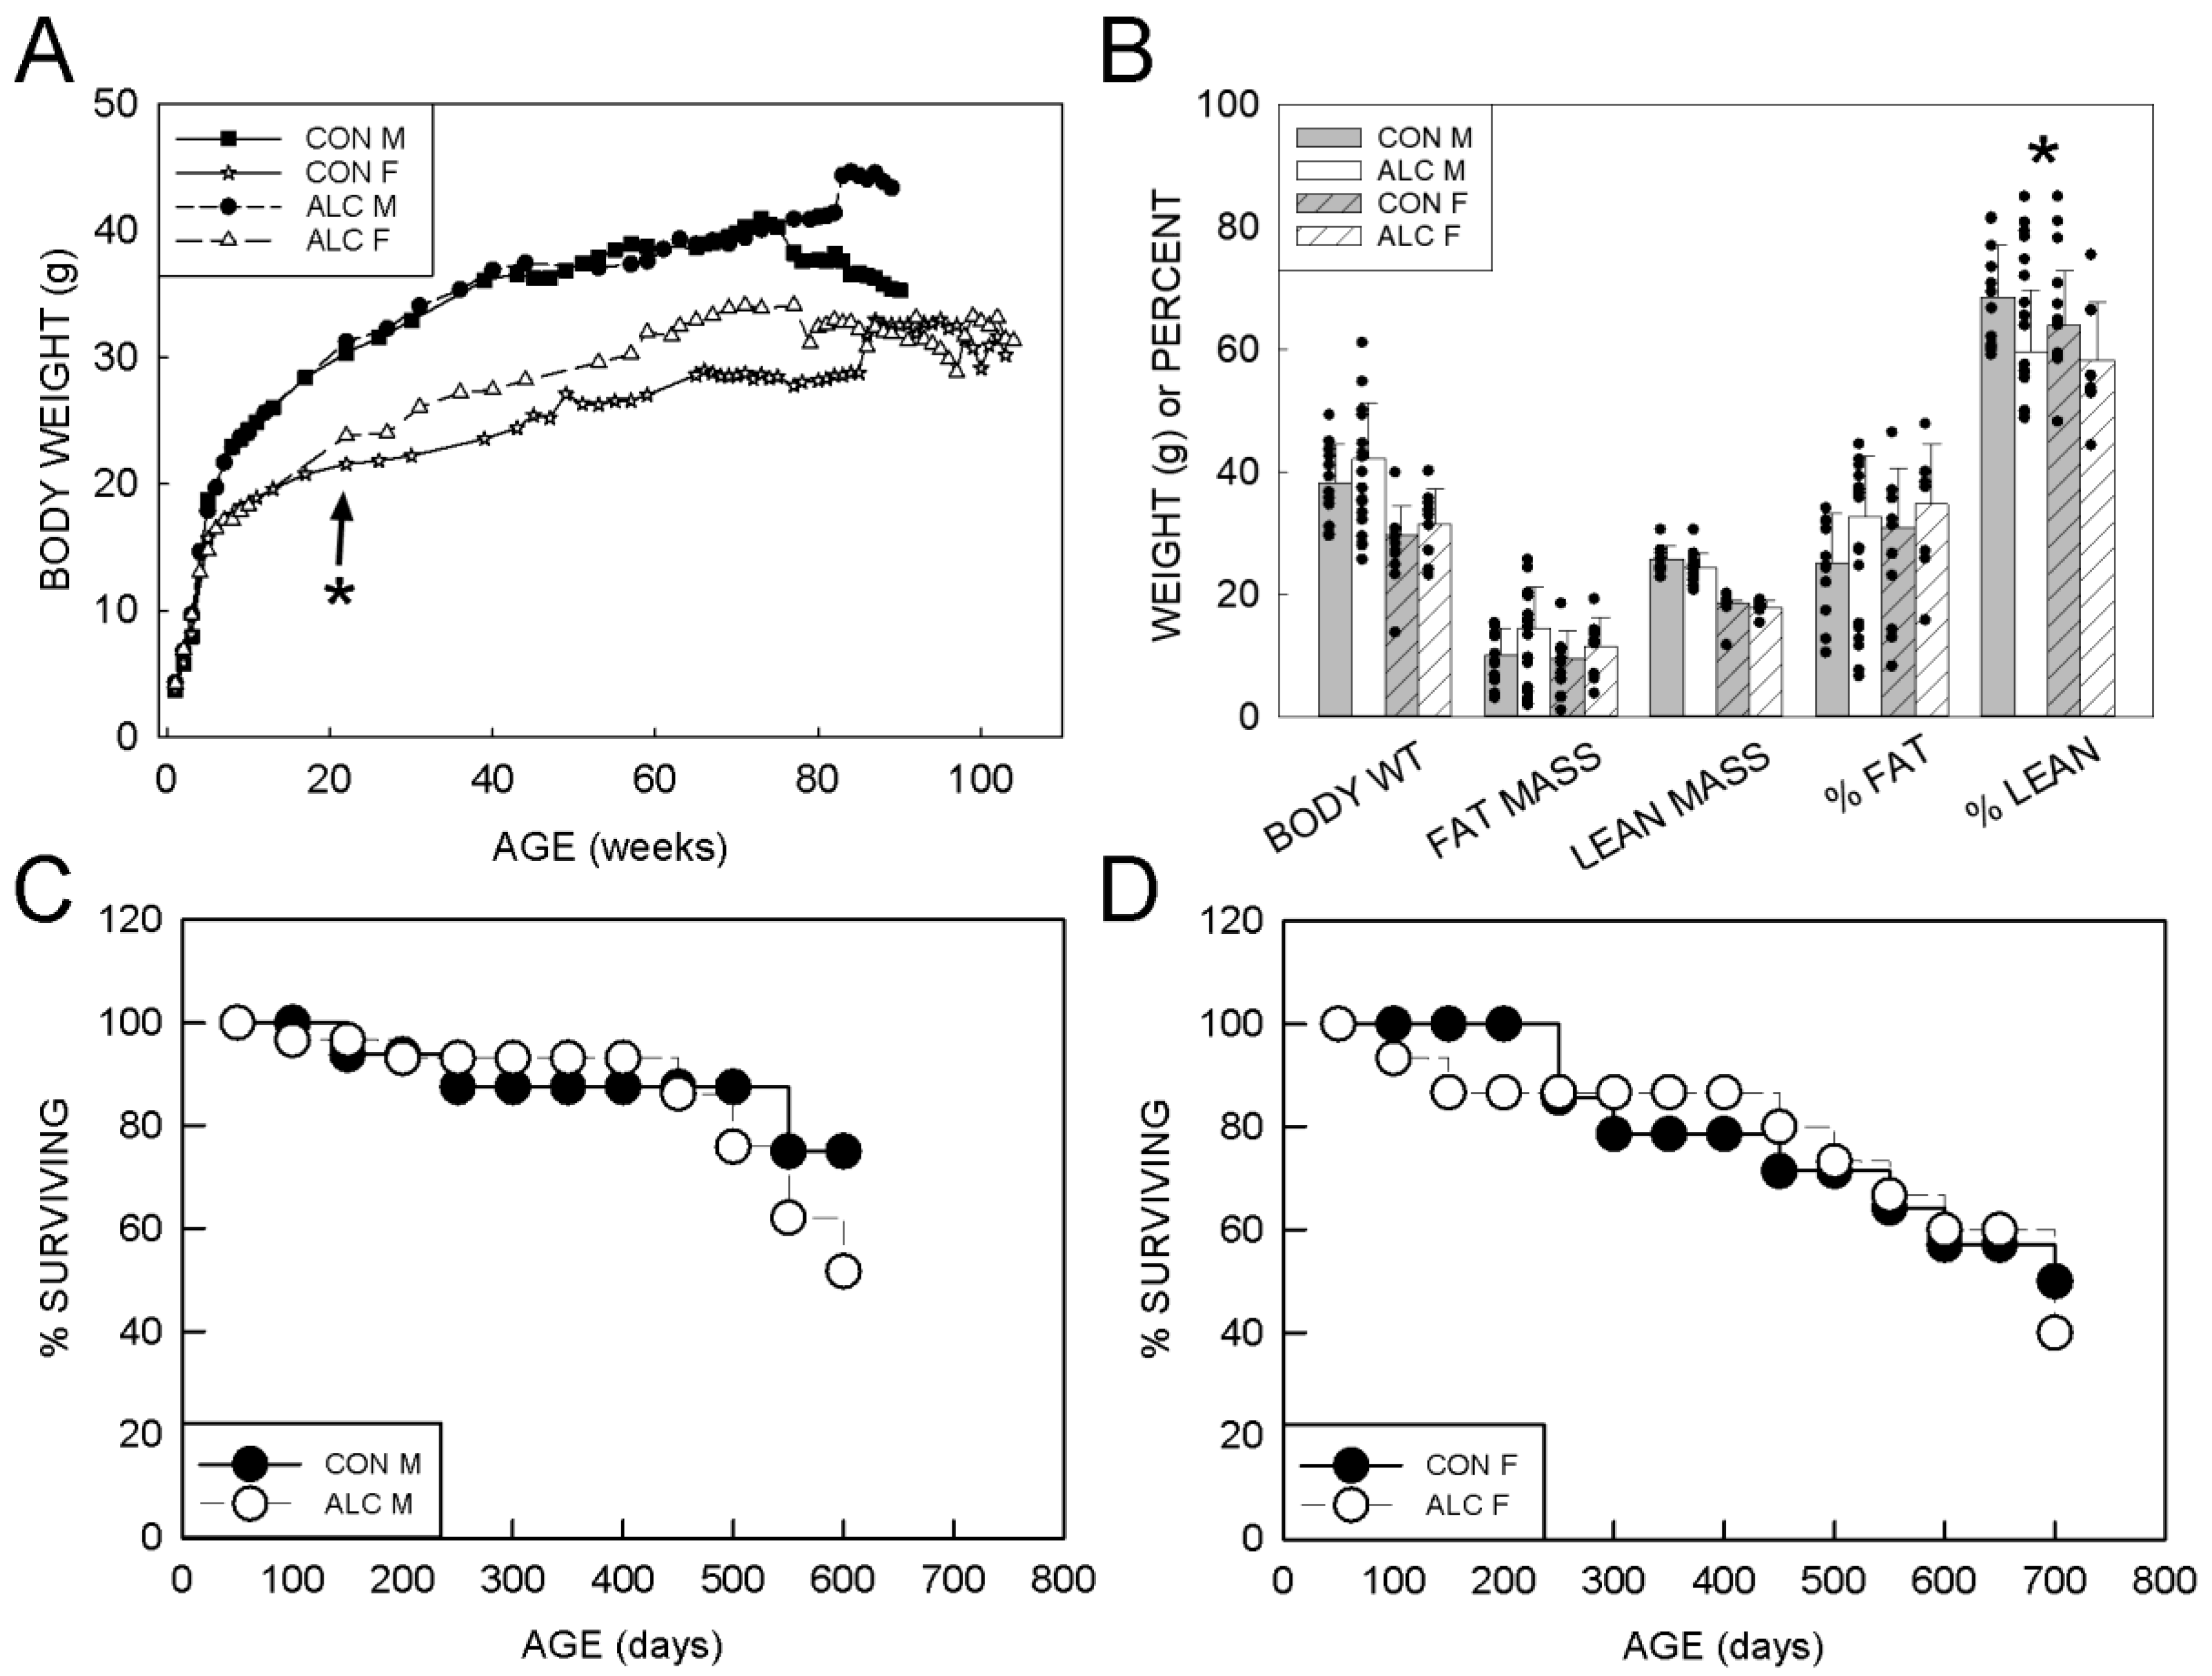
Abstract
:1. Introduction
2. Materials and Methods
2.1. Mice and Husbandry
2.2. Behavioral Assessments
2.3. Metabolic Assessment
2.4. Statistical Analysis
3. Results
3.1. Growth and Metabolic Outcomes
3.1.1. Body Weight
3.1.2. Body Composition
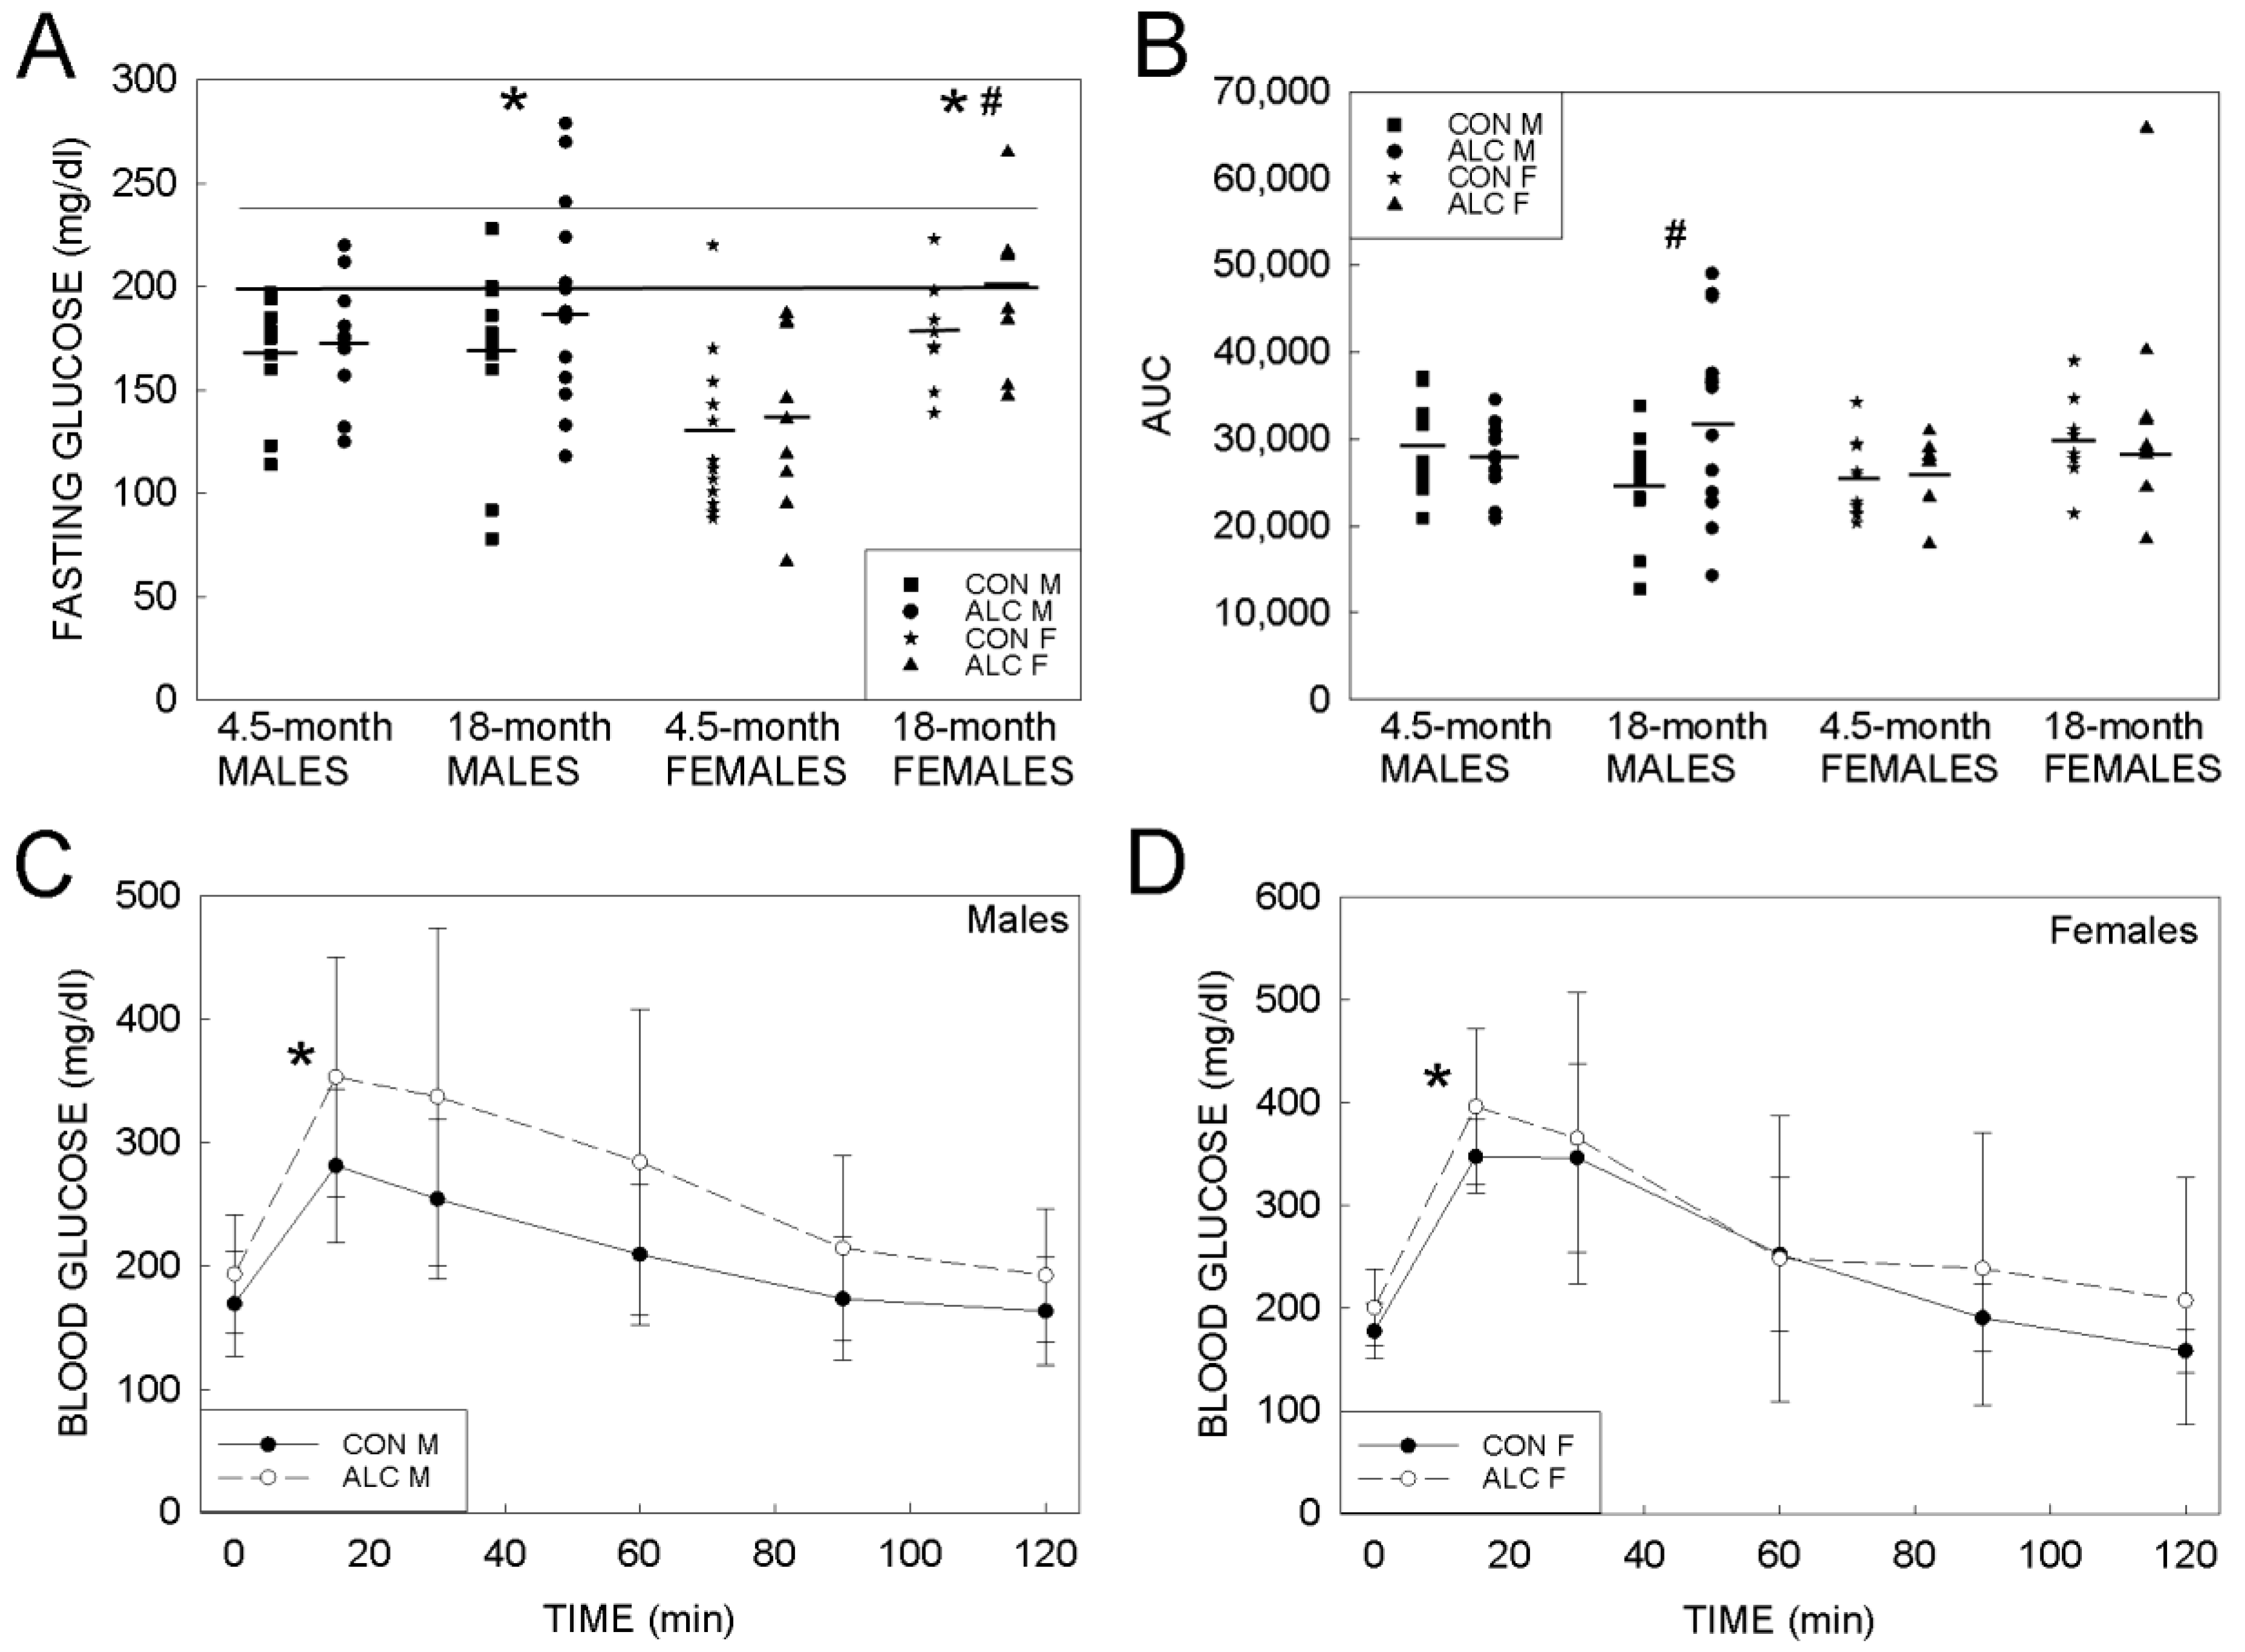
3.1.3. Glucose Tolerance
3.1.4. Survival
3.2. Behavioral Assessment
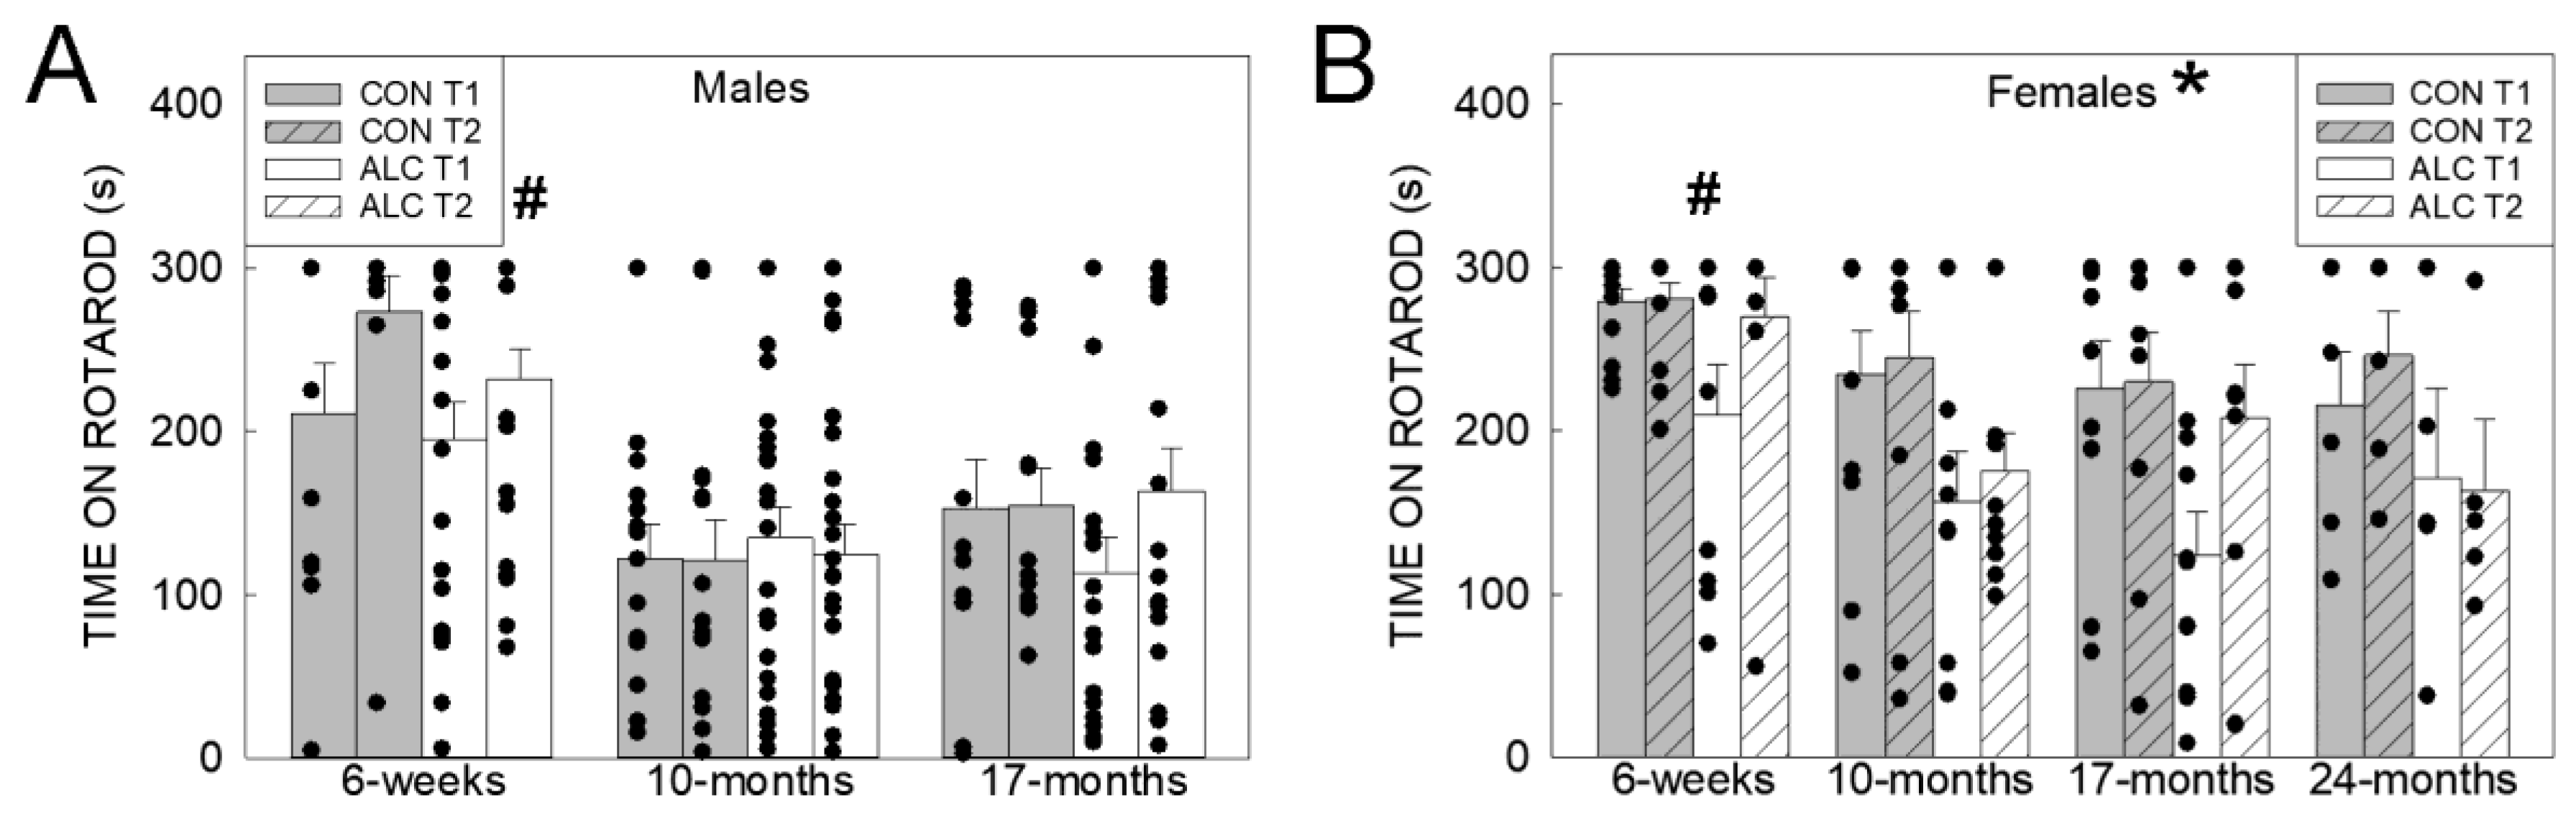
3.2.1. Rotarod
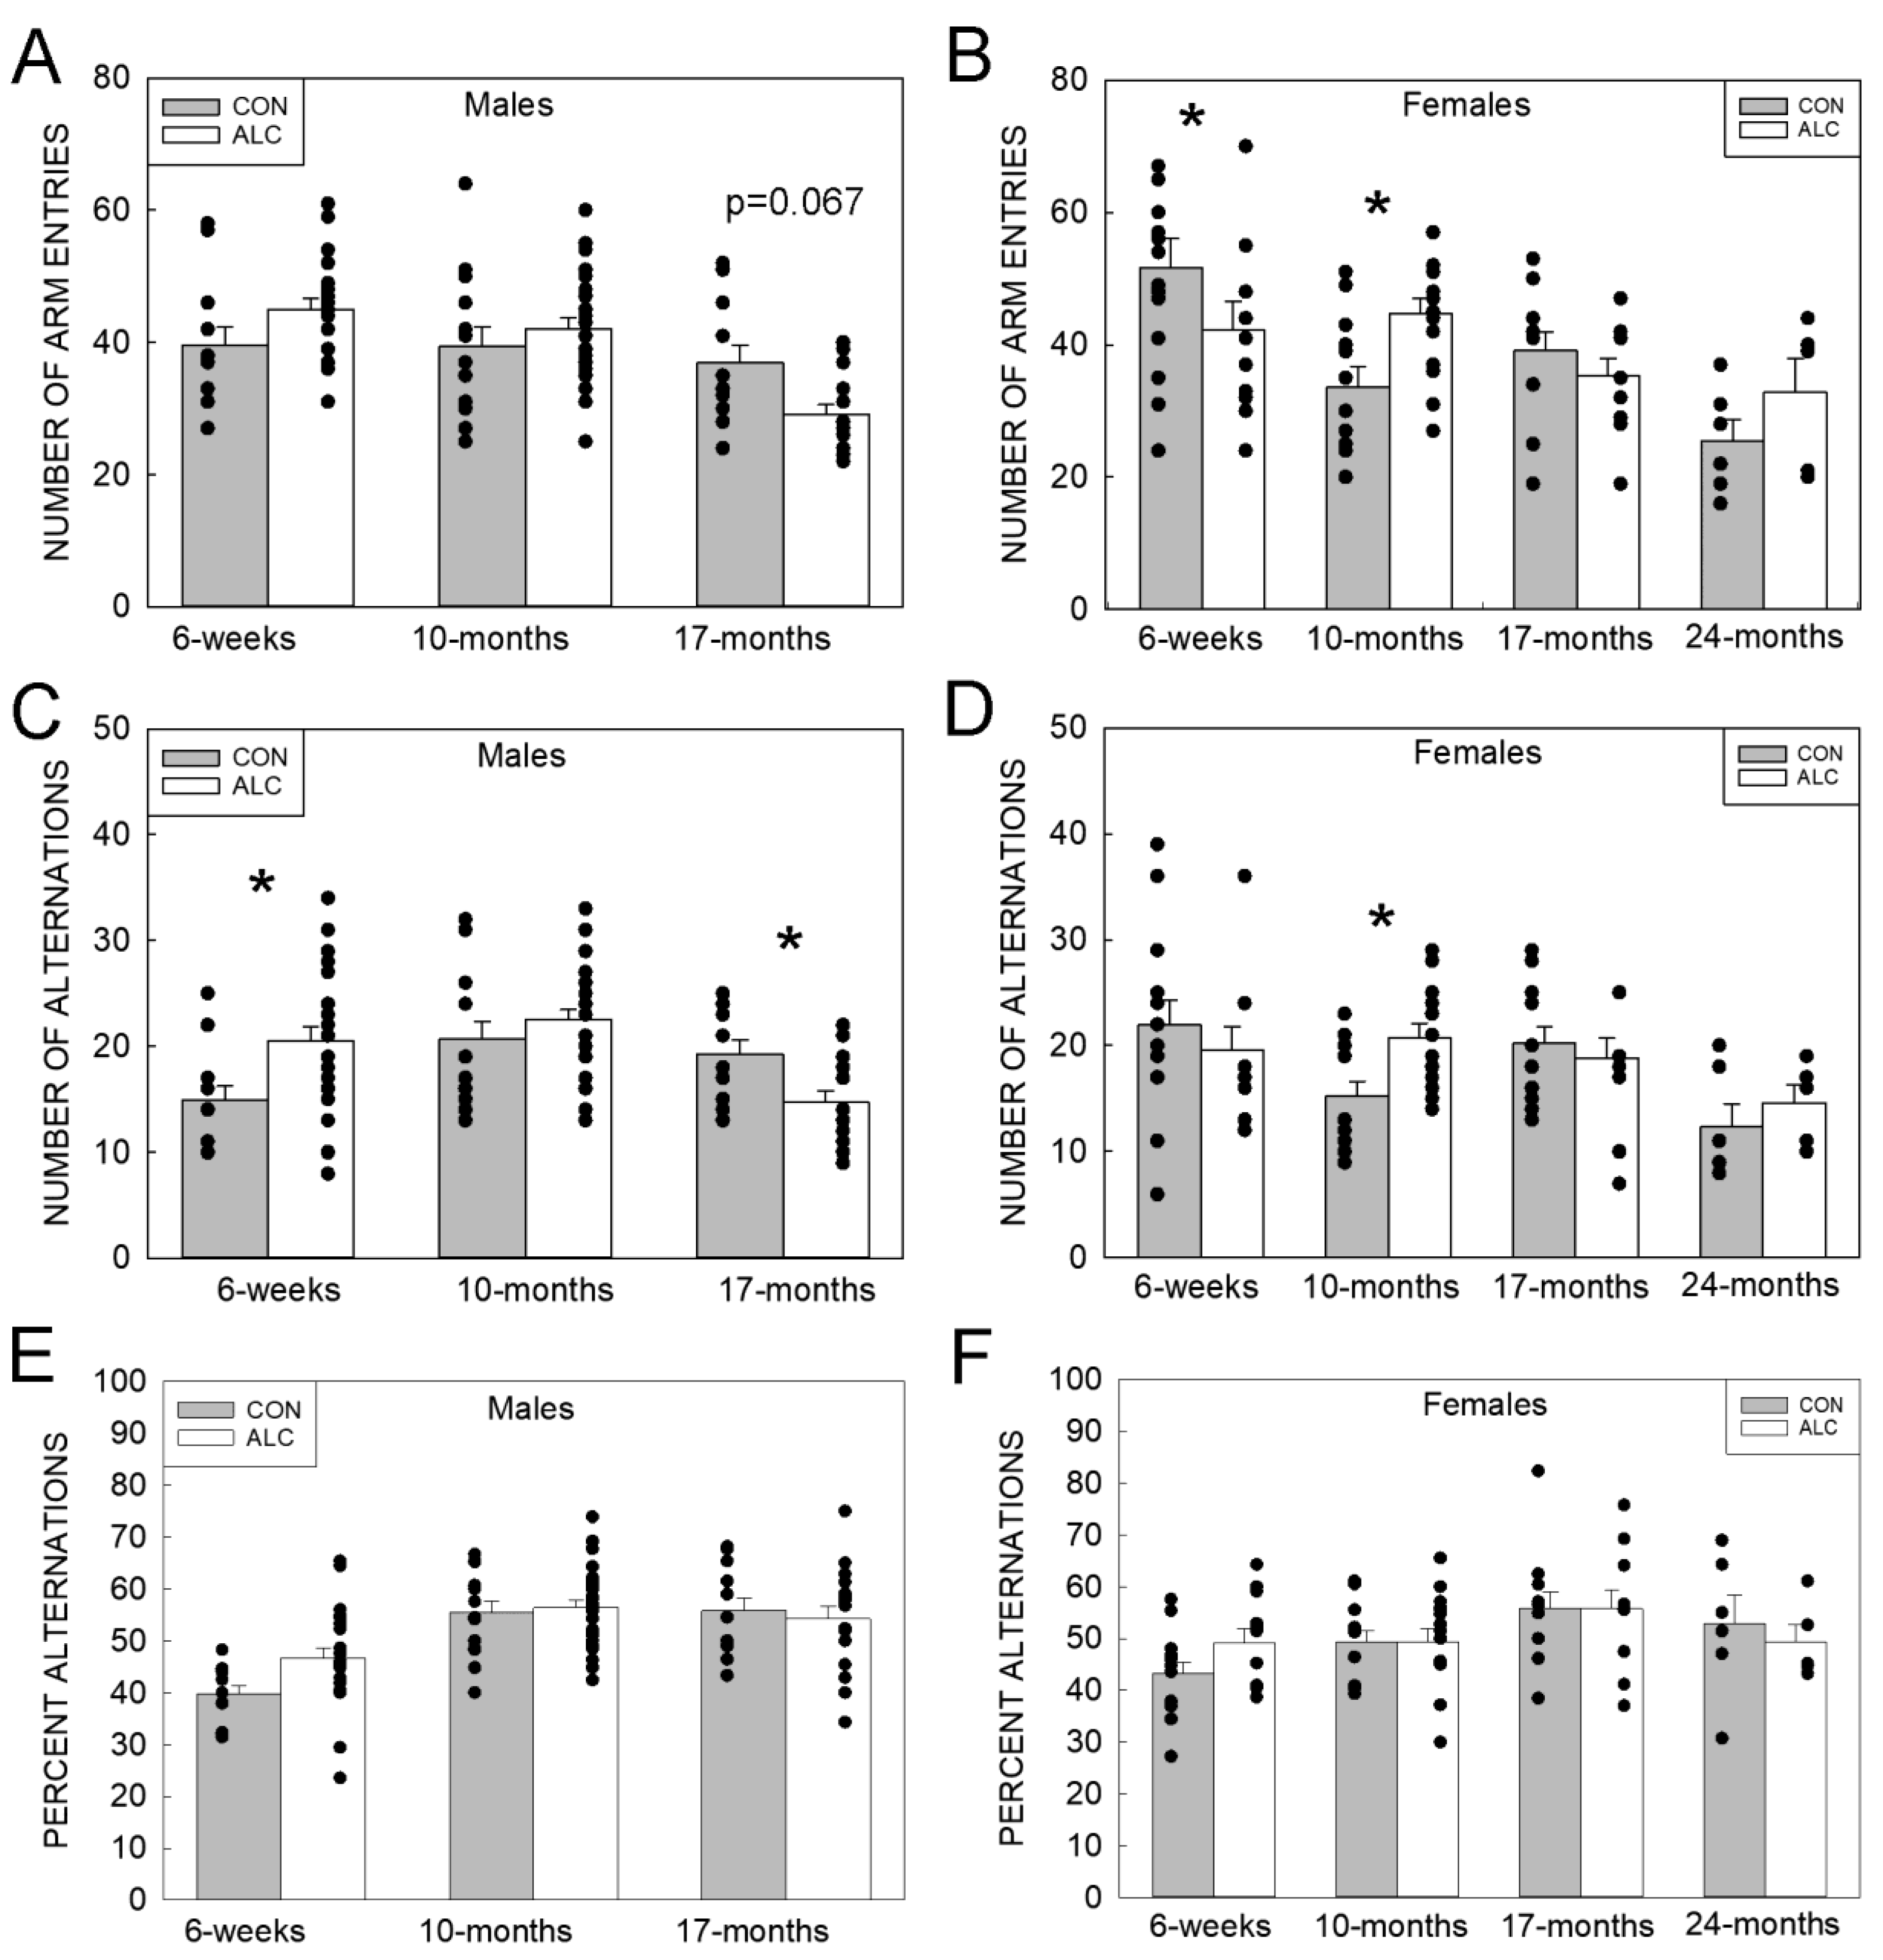
3.2.2. Y-Maze
3.2.3. Novel Object Recognition
3.2.4. Fear Conditioning
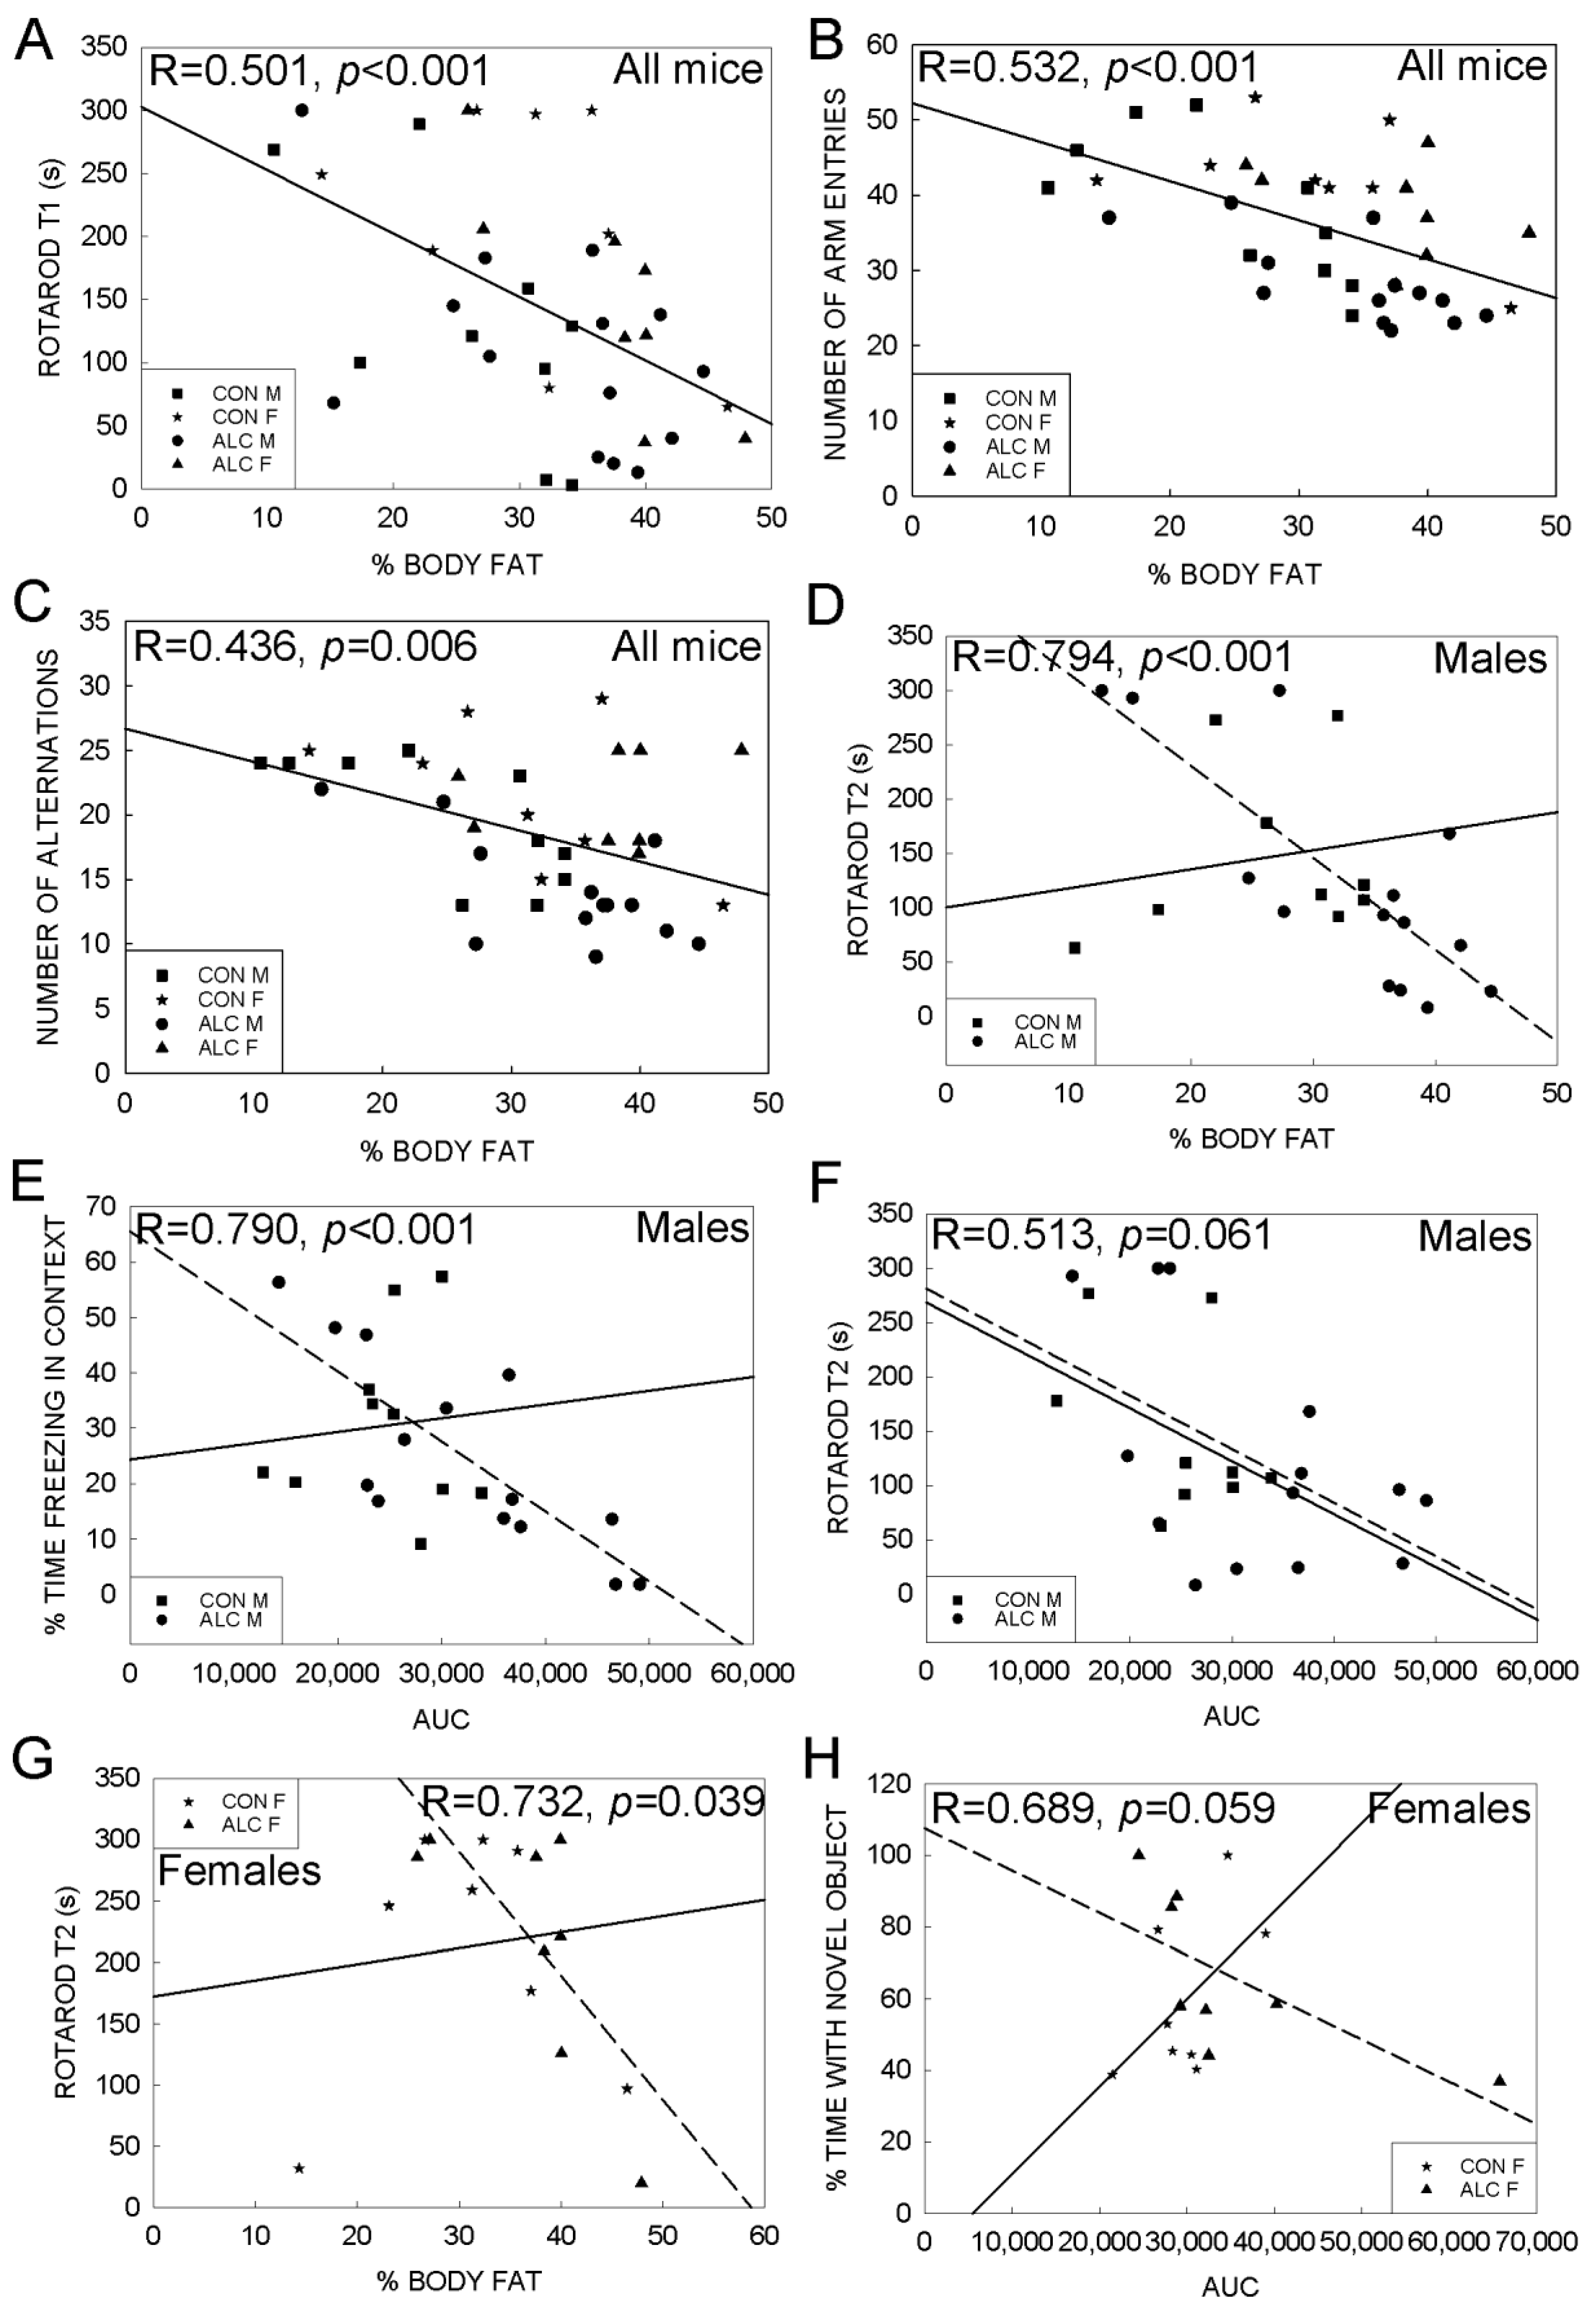
3.3. Association Analyses
4. Discussion
5. Conclusions
Supplementary Materials
Author Contributions
Funding
Institutional Review Board Statement
Informed Consent Statement
Data Availability Statement
Conflicts of Interest
References
- Hoyme, H.E.; Kalberg, W.O.; Elliott, A.J.; Blankenship, J.; Buckley, D.; Marais, A.-S.; Manning, M.A.; Robinson, L.K.; Adam, M.P.; Abdul-Rahman, O.; et al. Updated Clinical Guidelines for Diagnosing Fetal Alcohol Spectrum Disorders. Pediatrics 2016, 138, e20154256. [Google Scholar] [CrossRef] [Green Version]
- Gosdin, L.K.; Deputy, N.P.; Kim, S.Y.; Dang, E.P.; Denny, C.H. Alcohol Consumption and Binge Drinking During Pregnancy Among Adults Aged 18–49 Years—United States, 2018–2020. MMWR. Morb. Mortal. Wkly. Rep. 2022, 71, 10–13. [Google Scholar] [CrossRef]
- May, P.A.; Chambers, C.D.; Kalberg, W.O.; Zellner, J.; Feldman, H.; Buckley, D.; Kopald, D.; Hasken, J.M.; Xu, R.; Honerkamp-Smith, G.; et al. Prevalence of Fetal Alcohol Spectrum Disorders in 4 US Communities. JAMA 2018, 319, 474–482. [Google Scholar] [CrossRef]
- Lynch, M.E.; Kable, J.A.; Coles, C.D. Effects of prenatal alcohol exposure in a prospective sample of young adults: Mental health, substance use, and difficulties with the legal system. Neurotoxicol. Teratol. 2017, 64, 50–62. [Google Scholar] [CrossRef]
- Spohr, H.L.; Willms, J.; Steinhausen, H.C. Prenatal alcohol exposure and long-term developmental consequences. Lancet 1993, 341, 907–910. [Google Scholar] [CrossRef]
- Streissguth, A.P. Fetal alcohol syndrome in older patients. Alcohol Alcohol. Suppl. 1993, 2, 209–212. [Google Scholar]
- Jacobson, S.W.; Hoyme, H.E.; Carter, R.C.; Dodge, N.C.; Molteno, C.D.; Meintjes, E.M.; Jacobson, J.L. Evolution of the Physical Phenotype of Fetal Alcohol Spectrum Disorders from Childhood through Adolescence. Alcohol. Clin. Exp. Res. 2021, 45, 395–408. [Google Scholar] [CrossRef]
- López-Otín, C.; Blasco, M.A.; Partridge, L.; Serrano, M.; Kroemer, G. The hallmarks of aging. Cell 2013, 153, 1194–1217. [Google Scholar] [CrossRef] [Green Version]
- Guggenmos, M.; Schmack, K.; Sekutowicz, M.; Garbusow, M.; Sebold, M.; Sommer, C.; Smolka, M.N.; Wittchen, H.-U.; Zimmermann, U.S.; Heinz, A.; et al. Quantitative neurobiological evidence for accelerated brain aging in alcohol dependence. Transl. Psychiatry 2017, 7, 1279. [Google Scholar] [CrossRef] [Green Version]
- Fries, J.F.; Bruce, B.; Chakravarty, E. Compression of morbidity 1980–2011: A focused review of paradigms and progress. J. Aging Res. 2011, 2011, 261702. [Google Scholar] [CrossRef]
- Himmelreich, M.; Lutke, C.J.; Hargrove, E.T. The lay of the land: Fetal alcohol spectrum disorder (FASD) as a whole-body diagnosis. In The Routledge Handbook of Social Work and Addictive Behaviors, 1st ed.; Begun, A.L., Murray, M.M., Eds.; Routledge: London, UK, 2020; pp. 191–215. [Google Scholar] [CrossRef]
- Weeks, O.; Bossé, G.D.; Oderberg, I.M.; Akle, S.; Houvras, Y.; Wrighton, P.J.; LaBella, K.; Iversen, I.; Tavakoli, S.; Adatto, I.; et al. Fetal alcohol spectrum disorder predisposes to metabolic abnormalities in adulthood. J. Clin. Invest. 2020, 130, 2252–2269. [Google Scholar] [CrossRef] [Green Version]
- Castells, S.; Mark, E.; Abaci, F.; Schwartz, E. Growth retardation in fetal alcohol syndrome. Unresponsiveness to growth-promoting hormones. Dev. Pharmacol. Ther. 1981, 3, 232–241. [Google Scholar] [CrossRef]
- Kable, J.A.; Mehta, P.K.; Coles, C.D. Alterations in Insulin Levels in Adults with Prenatal Alcohol Exposure. Alcohol. Clin. Exp. Res. 2021, 45, 500–506. [Google Scholar] [CrossRef]
- Amos-Kroohs, R.M.; Fink, B.A.; Smith, C.J.; Chin, L.; Van Calcar, S.C.; Wozniak, J.R.; Smith, S.M. Abnormal Eating Behaviors Are Common in Children with Fetal Alcohol Spectrum Disorder. J. Pediatr. 2016, 169, 194–200.e1. [Google Scholar] [CrossRef] [Green Version]
- Werts, R.L.; Van Calcar, S.C.; Wargowski, D.S.; Smith, S.M. Inappropriate feeding behaviors and dietary intakes in children with fetal alcohol spectrum disorder or probable prenatal alcohol exposure. Alcohol. Clin. Exp. Res. 2014, 38, 871–878. [Google Scholar] [CrossRef] [Green Version]
- Hayes, N.; Reid, N.; Akison, L.K.; Moritz, K.M. The effect of heavy prenatal alcohol exposure on adolescent body mass index and waist-to-height ratio at 12–13 years. Int. J. Obes. 2021, 45, 2118–2125. [Google Scholar] [CrossRef]
- Reid, N.; Moritz, K.M.; Akison, L.K. Adverse health outcomes associated with fetal alcohol exposure: A systematic review focused on immune-related outcomes. Pediatr. Allergy Immunol. 2019, 30, 698–707. [Google Scholar] [CrossRef]
- Bodnar, T.S.; Hill, L.A.; Weinberg, J. Evidence for an immune signature of prenatal alcohol exposure in female rats. Brain. Behav. Immun. 2016, 58, 130–141. [Google Scholar] [CrossRef] [Green Version]
- Cantacorps, L.; Alfonso-Loeches, S.; Moscoso-Castro, M.; Cuitavi, J.; Gracia-Rubio, I.; López-Arnau, R.; Escubedo, E.; Guerri, C.; Valverde, O. Maternal alcohol binge drinking induces persistent neuroinflammation associated with myelin damage and behavioural dysfunctions in offspring mice. Neuropharmacology 2017, 123, 368–384. [Google Scholar] [CrossRef] [Green Version]
- Noor, S.; Milligan, E.D. Lifelong Impacts of Moderate Prenatal Alcohol Exposure on Neuroimmune Function. Front. Immunol. 2018, 9, 1107. [Google Scholar] [CrossRef]
- Hotamisligil, G.S. Inflammation and metabolic disorders. Nature 2006, 444, 860–867. [Google Scholar] [CrossRef]
- Lunde, E.R.; Washburn, S.E.; Golding, M.C.; Bake, S.; Miranda, R.C.; Ramadoss, J. Alcohol-Induced Developmental Origins of Adult-Onset Diseases. Alcohol. Clin. Exp. Res. 2016, 40, 1403–1414. [Google Scholar] [CrossRef] [Green Version]
- Mooney, S.M.; Pjetri, E.; Friday, W.B.; Smith, S.M. Growth and Behavioral Differences in a C56BL/6J Mouse Model of Prenatal Alcohol Exposure. Alcohol 2021, 97, 51–57. [Google Scholar] [CrossRef]
- Virdee, M.S.; Saini, N.; Kay, C.D.; Neilson, A.P.; Kwan, S.T.C.; Helfrich, K.K.; Mooney, S.M.; Smith, S.M. An enriched biosignature of gut microbiota-dependent metabolites characterizes maternal plasma in a mouse model of fetal alcohol spectrum disorder. Sci. Rep. 2021, 11, 248. [Google Scholar] [CrossRef]
- Reeves, P.G.; Nielsen, F.H.; Fahey, G.C. AIN-93 Purified Diets for Laboratory Rodents: Final Report of the American Institute of Nutrition Ad Hoc Writing Committee on the Reformulation of the AIN-76A Rodent Diet. J. Nutr. 1993, 123, 1939–1951. [Google Scholar] [CrossRef]
- Amos-Kroohs, R.M.; Nelson, D.W.; Hacker, T.A.; Yen, C.-L.E.; Smith, S.M. Does prenatal alcohol exposure cause a metabolic syndrome? (Non-)evidence from a mouse model of fetal alcohol spectrum disorder. PLoS ONE 2018, 13, e0199213. [Google Scholar] [CrossRef]
- Akison, L.K.; Reid, N.; Wyllie, M.; Moritz, K.M. Adverse Health Outcomes in Offspring Associated with Fetal Alcohol Exposure: A Systematic Review of Clinical and Preclinical Studies with a Focus on Metabolic and Body Composition Outcomes. Alcohol. Clin. Exp. Res. 2019, 43, 1324–1343. [Google Scholar] [CrossRef]
- Clee, S.M.; Attie, A.D. The genetic landscape of type 2 diabetes in mice. Endocr. Rev. 2007, 28, 48–83. [Google Scholar] [CrossRef] [Green Version]
- Han, B.G.; Hao, C.M.; Tchekneva, E.E.; Wang, Y.Y.; Chieh, A.L.; Ebrahim, B.; Harris, R.C.; Kern, T.S.; Wasserman, D.H.; Breyer, M.D.; et al. Markers of glycemic control in the mouse: Comparisons of 6-h- and overnight-fasted blood glucoses to Hb A1c. Am. J. Physiol. Endocrinol. Metab. 2008, 295, E981–E986. [Google Scholar] [CrossRef] [Green Version]
- Profenno, L.A.; Porsteinsson, A.P.; Faraone, S.V. Meta-analysis of Alzheimer’s disease risk with obesity, diabetes, and related disorders. Biol. Psychiatry 2010, 67, 505–512. [Google Scholar] [CrossRef]
- Gottesman, R.F.; Albert, M.S.; Alonso, A.; Coker, L.H.; Coresh, J.; Davis, S.M.; Deal, J.A.; McKhann, G.M.; Mosley, T.H.; Sharrett, A.R.; et al. Associations Between Midlife Vascular Risk Factors and 25-Year Incident Dementia in the Atherosclerosis Risk in Communities (ARIC) Cohort. JAMA Neurol. 2017, 74, 1246–1254. [Google Scholar] [CrossRef]
- Saini, N.; Virdee, M.S.; Helfrich, K.K.; Kwan, S.T.C.; Mooney, S.M. Untargeted metabolome analysis reveals reductions in maternal hepatic glucose and amino acid content that correlate with fetal organ weights in a mouse model of Fetal Alcohol Spectrum Disorders. Nutrients 2022, 14, 1096. [Google Scholar] [CrossRef]
- Gårdebjer, E.M.; Cuffe, J.S.M.; Ward, L.C.; Steane, S.; Anderson, S.T.; Dorey, E.S.; Kalisch-Smith, J.I.; Pantaleon, M.; Chong, S.; Yamada, L.; et al. Effects of periconceptional maternal alcohol intake and a postnatal high-fat diet on obesity and liver disease in male and female rat offspring. Am. J. Physiol. Metab. 2018, 315, E694–E704. [Google Scholar] [CrossRef]
- Nguyen, T.M.T.; Steane, S.E.; Moritz, K.M.; Akison, L.K. Prenatal alcohol exposure programmes offspring disease: Insulin resistance in adult males in a rat model of acute exposure. J. Physiol. 2019, 597, 5619–5637. [Google Scholar] [CrossRef]
- Dobson, C.C.; Mongillo, D.L.; Brien, D.C.; Stepita, R.; Poklewska-Koziell, M.; Winterborn, A.; Holloway, A.C.; Brien, J.F.; Reynolds, J.N. Chronic prenatal ethanol exposure increases adiposity and disrupts pancreatic morphology in adult guinea pig offspring. Nutr. Diabetes 2012, 2, e57. [Google Scholar] [CrossRef] [Green Version]
- Probyn, M.E.; Parsonson, K.R.; Gårdebjer, E.M.; Ward, L.C.; Wlodek, M.E.; Anderson, S.T.; Moritz, K.M. Impact of low dose prenatal ethanol exposure on glucose homeostasis in Sprague-Dawley rats aged up to eight months. PLoS ONE 2013, 8, e59718. [Google Scholar] [CrossRef] [Green Version]
- Gårdebjer, E.M.; Anderson, S.T.; Pantaleon, M.; Wlodek, M.E.; Moritz, K.M. Maternal alcohol intake around the time of conception causes glucose intolerance and insulin insensitivity in rat offspring, which is exacerbated by a postnatal high-fat diet. FASEB J. 2015, 29, 2690–2701. [Google Scholar] [CrossRef] [Green Version]
- Kaminen-Ahola, N.; Ahola, A.; Maga, M.; Mallitt, K.A.; Fahey, P.; Cox, T.C.; Whitelaw, E.; Chong, S. Maternal ethanol consumption alters the epigenotype and the phenotype of offspring in a mouse model. PLoS Genet. 2010, 6, e1000811. [Google Scholar] [CrossRef] [Green Version]
- Carter, R.C.; Jacobson, J.L.; Molteno, C.D.; Dodge, N.C.; Meintjes, E.M.; Jacobson, S.W. Fetal Alcohol Growth Restriction and Cognitive Impairment. Pediatrics 2016, 138, e20160775. [Google Scholar] [CrossRef] [Green Version]
- Fuglestad, A.J.; Boys, C.J.; Chang, P.N.; Miller, B.S.; Eckerle, J.K.; Deling, L.; Fink, B.A.; Hoecker, H.L.; Hickey, M.K.; Jimenez-Vega, J.M.; et al. Overweight and obesity among children and adolescents with fetal alcohol spectrum disorders. Alcohol. Clin. Exp. Res. 2014, 38, 2502–2508. [Google Scholar] [CrossRef] [Green Version]
- Cheong, J.N.; Wlodek, M.E.; Moritz, K.M.; Cuffe, J.S.M. Programming of maternal and offspring disease: Impact of growth restriction, fetal sex and transmission across generations. J. Physiol. 2016, 594, 4727–4740. [Google Scholar] [CrossRef] [Green Version]
- Aiken, C.E.; Ozanne, S.E. Sex differences in developmental programming models. Reproduction 2013, 145, R1–R13. [Google Scholar] [CrossRef] [Green Version]
- Kwan, S.T.; Ricketts, D.K.; Presswood, B.H.; Smith, S.M.; Mooney, S.M. Prenatal choline supplementation during mouse pregnancy has differential effects in alcohol-exposed fetal organs. Alcohol. Clin. Exp. Res. 2021, 45, 2471–2484. [Google Scholar] [CrossRef]
- Kwan, S.T.C.; Presswood, B.H.; Helfrich, K.K.; Baulch, J.W.; Mooney, S.M.; Smith, S.M. An interaction between fetal sex and placental weight and efficiency predicts intrauterine growth in response to maternal protein insufficiency and gestational exposure window in a mouse model of FASD. Biol. Sex Differ. 2020, 11, 1–15. [Google Scholar] [CrossRef]
- Alfaro, F.J.; Gavrieli, A.; Saade-Lemus, P.; Lioutas, V.-A.A.; Upadhyay, J.; Novak, V. White matter microstructure and cognitive decline in metabolic syndrome: A review of diffusion tensor imaging. Metabolism. 2018, 78, 52–68. [Google Scholar] [CrossRef]
- Bangen, K.J.; Armstrong, N.M.; Au, R.; Gross, A.L. Metabolic Syndrome and Cognitive Trajectories in the Framingham Offspring Study. J. Alzheimer’s Dis. 2019, 71, 931–943. [Google Scholar] [CrossRef]
- Frisardi, V.; Solfrizzi, V.; Seripa, D.; Capurso, C.; Santamato, A.; Sancarlo, D.; Vendemiale, G.; Pilotto, A.; Panza, F. Metabolic-cognitive syndrome: A cross-talk between metabolic syndrome and Alzheimer’s disease. Ageing Res. Rev. 2010, 9, 399–417. [Google Scholar] [CrossRef]
- Panza, F.; Frisardi, V.; Capurso, C.; Imbimbo, B.P.; Vendemiale, G.; Santamato, A.; D’Onofrio, G.; Seripa, D.; Sancarlo, D.; Pilotto, A.; et al. Metabolic Syndrome and Cognitive Impairment: Current Epidemiology and Possible Underlying Mechanisms. J. Alzheimer’s Dis. 2010, 21, 691–724. [Google Scholar] [CrossRef]
- Pan, H.; Finkel, T. Key proteins and pathways that regulate lifespan. J. Biol. Chem. 2017, 292, 6452–6460. [Google Scholar] [CrossRef] [Green Version]


Publisher’s Note: MDPI stays neutral with regard to jurisdictional claims in published maps and institutional affiliations. |
© 2022 by the authors. Licensee MDPI, Basel, Switzerland. This article is an open access article distributed under the terms and conditions of the Creative Commons Attribution (CC BY) license (https://creativecommons.org/licenses/by/4.0/).
Share and Cite
Smith, S.M.; Pjetri, E.; Friday, W.B.; Presswood, B.H.; Ricketts, D.K.; Walter, K.R.; Mooney, S.M. Aging-Related Behavioral, Adiposity, and Glucose Impairments and Their Association following Prenatal Alcohol Exposure in the C57BL/6J Mouse. Nutrients 2022, 14, 1438. https://doi.org/10.3390/nu14071438
Smith SM, Pjetri E, Friday WB, Presswood BH, Ricketts DK, Walter KR, Mooney SM. Aging-Related Behavioral, Adiposity, and Glucose Impairments and Their Association following Prenatal Alcohol Exposure in the C57BL/6J Mouse. Nutrients. 2022; 14(7):1438. https://doi.org/10.3390/nu14071438
Chicago/Turabian StyleSmith, Susan M., Eneda Pjetri, Walter B. Friday, Brandon H. Presswood, Dane K. Ricketts, Kathleen R. Walter, and Sandra M. Mooney. 2022. "Aging-Related Behavioral, Adiposity, and Glucose Impairments and Their Association following Prenatal Alcohol Exposure in the C57BL/6J Mouse" Nutrients 14, no. 7: 1438. https://doi.org/10.3390/nu14071438